Customer service analytics: A guide by a Support Team Lead

Customer Support Manager - Tier 1
Tags
Share
No one’s going to argue with you about the importance of good customer service. (At least, no one’s ever tried to argue with me about it.)
But how exactly do you provide that level of service, without resorting to unhelpful, general platitudes like “the customer’s always right” and “just go the extra mile?”
Well, I’d say that using customer service analytics is a pretty important part of successfully doing this.
In this post, we’ll look at a few tips for gathering and measuring customer service analytics, some use cases, which specific metrics to look at, and more.
What is customer service analytics?
Customer service analytics refers to capturing and analysing customer data and metrics to help you improve your customer experience.
These analytics can come from a variety of places—typically, a good starting point is your support team’s everyday customer interactions (like phone calls, live chat messages, social media messages, support tickets, and survey responses).
Analysing this customer service data will show you where improvements need to be made, as well as providing valuable insights into your customers’ needs and expectations. This information will be crucial in your efforts to increase customer loyalty and retention.
👉 Dialpad tip:
Customer service analytics aren’t exactly the same thing as customer experience analytics, which refer to the overall customer experience (CX). Customer service metrics cover what happens after a customer has gotten in touch with your contact centre—they’re about more reactive, as opposed to proactive, things you can do.
How can data analytics help you improve your customer service?
It provides a more comprehensive view of customer engagement
The bigger your company grows, the more customer information you have access to, which includes insights into your customer journey, including customers’ preferences, pain points, and perceptions of your brand.
For example, are customers waiting a long time on hold when they call you? Are they facing decision-making obstacles (like an unclear return policy) during the checkout process on your website?
Data analytics enables you to bring together this information from different touchpoints to give you a quantitative view—which ideally will be used together with any qualitative feedback you’re getting from customers (like survey responses and call transcripts).
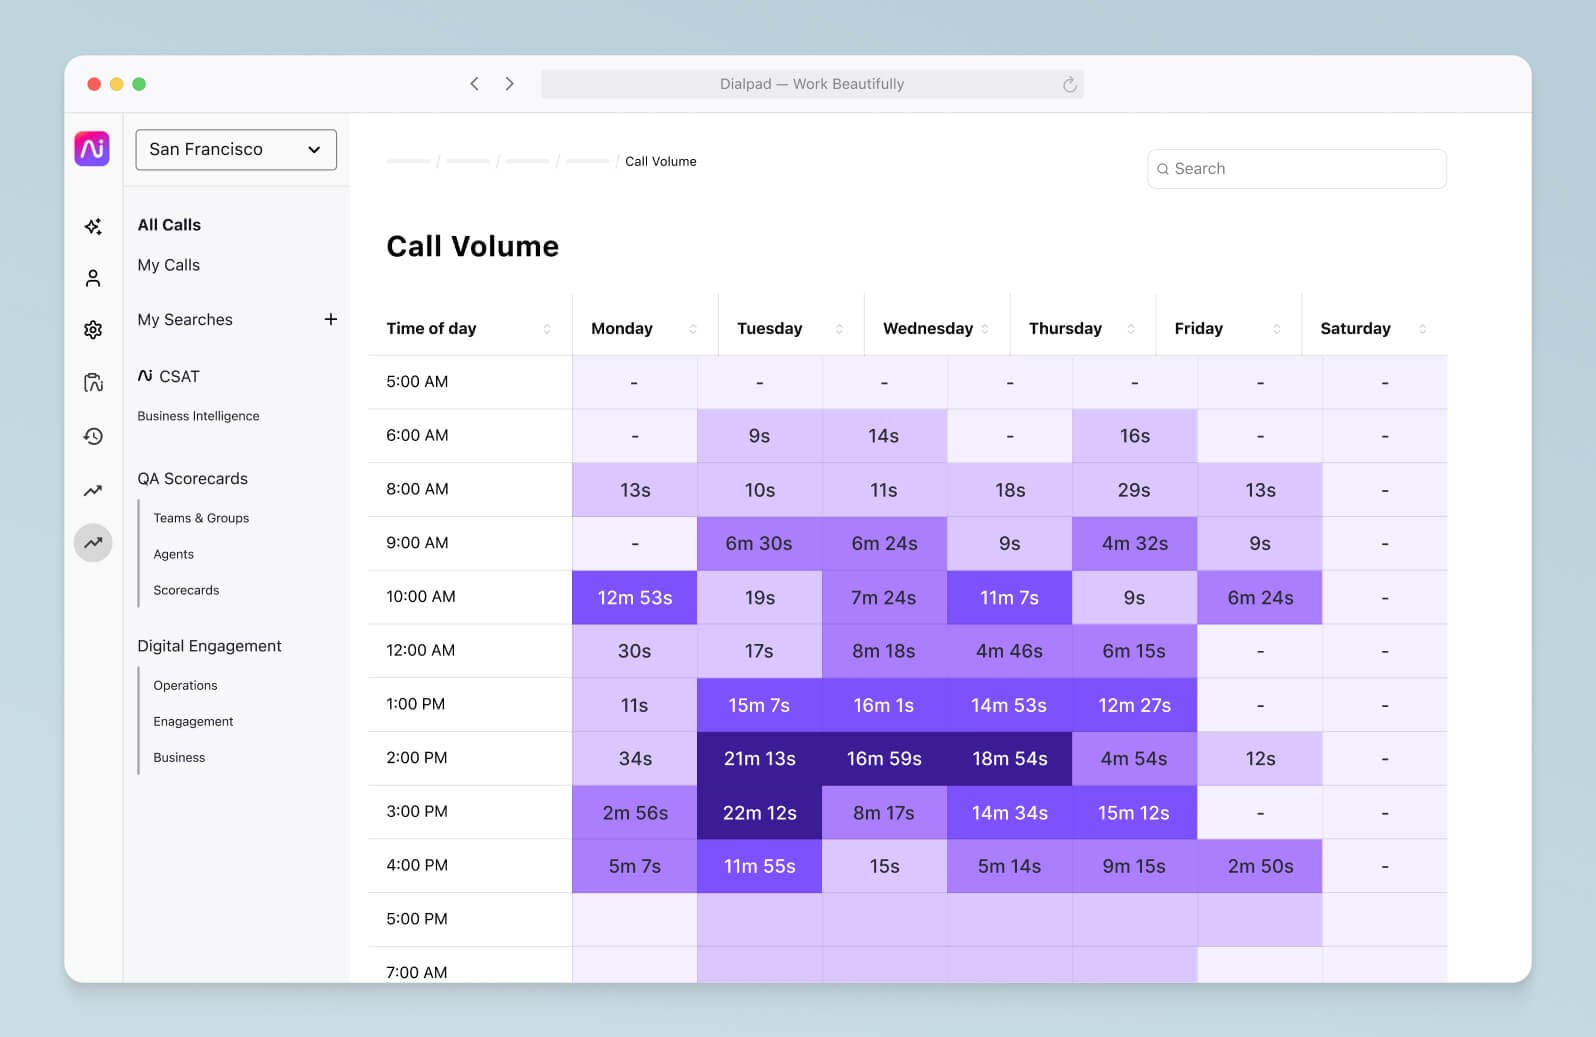
In Dialpad, we have a call analytics dashboard that shows us important information that we use to optimise the call centre customer experience. The built-in heat maps show us KPIs like average speed to answer:
And there’s even a feature that notifies supervisors when service levels (SLAs) drop below a certain threshold:
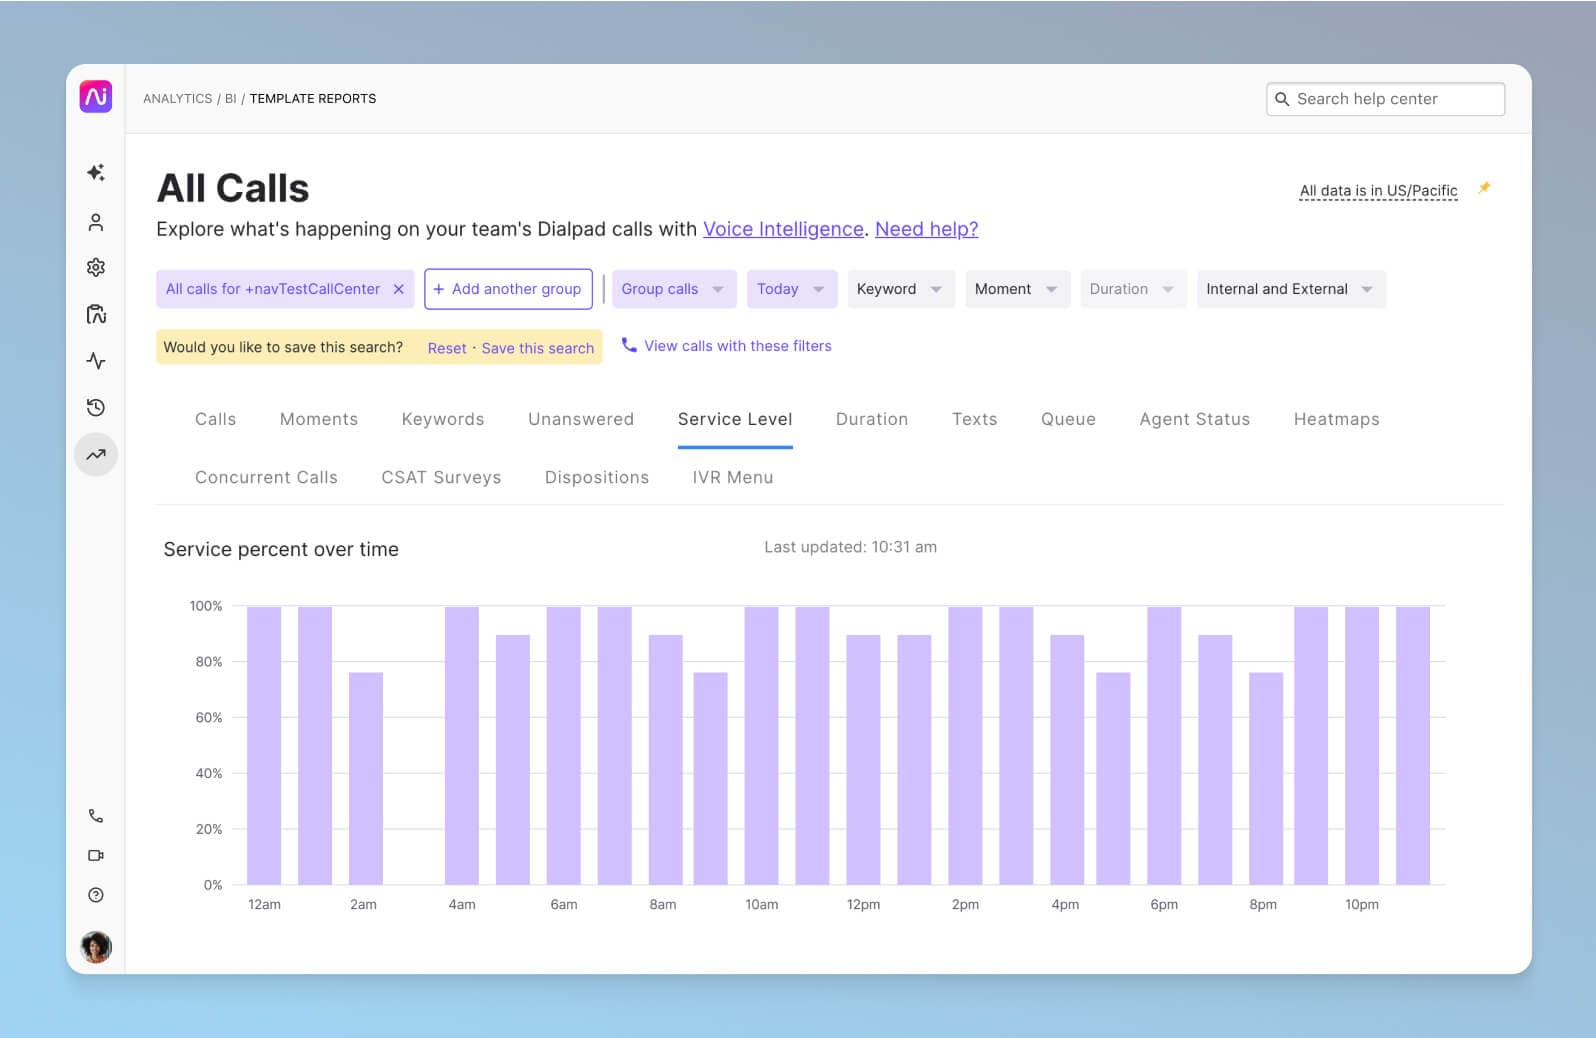
Without this data, we’d only have anecdotal stories and one-off complaints from customers or agents—this way, we can report on exactly where the gaps are in the customer journey, long customers are waiting, or how many more agents we may need to staff.
It helps you lower customer churn
This is mainly for subscription-based and software businesses that rely on recurring revenue, but one of the biggest advantages of having a good understanding of your customer experience analytics is that it helps you see where you’re losing customers.
Are your customers churning soon after the onboarding process? Or are you losing customer engagement further down the road, maybe a year after they’ve been with you? Your customer service team will be on the front lines of these conversations, and by tracking the analytics from these conversations, you’ll be able to narrow down the stages in your customer journey that are causing retention problems.
It improves retention and customer lifetime value
On a related note, data analytics can help you increase the value of your customers, whether that’s through increasing customer retention, uncovering cross-sell or upsell opportunities, or getting more referrals out of all that customer loyalty and goodwill you’ve built.
As a general rule, retaining customers costs your business less than attracting new ones. You don’t have to spend so much on marketing to existing customers, as they’re already in the fold, plus it’s far easier to sell products and services to them.
If a customer remains loyal and continues buying from you, they’ll have a higher customer lifetime value (CLV), which is the amount of revenue generated from one customer over the duration of their relationship with your brand.
What are different types of customer service analytics to consider?
There are many different ways to think about customer service analytics, and one way you could start to break these down is by going through your customer journey from beginning to end, and seeing what would be useful to measure in those stages.
For example, if you’re running an ecommerce store, you might categorise the types of customer service analytics you’re interested in by:
Channel — Which channels are you providing customer service through? Live chat? Phone? Social media, like WhatsApp or Facebook Messenger? What are your response times like for each of these channels?
Type of inquiry: What are the common types of customer service inquiries you get? For example, maybe the vast majority of questions you get are about refunds and exchanges, product questions, and complaints. How many of these are being successfully resolved right now, and how long is that taking?
Customer engagement today is omnichannel—it’s happening across a whole variety of different communication channels, and it’s more difficult than it used to be to keep track of all your analytics. (If you’re still running a call centre that focuses exclusively on phone calls, count yourself lucky, though that’s probably not going to be the case much longer!)
I’ll get into a few specific examples of metrics that a contact centre team should consider tracking in the next section.
6 important customer service metrics
Not every single contact centre needs to measure all six of these, but I’d consider these to be major key performance indicators (KPIs) or metrics you should at least consider measuring if you want to provide a better customer experience.
1. Customer satisfaction (CSAT)
Your customer satisfaction score, or CSAT, is a key element in your customer service data analytics, as it tells you how happy customers are after having interacted with your business.
What’s cool about CSAT scores is that they tell you how satisfied customers are with specific touchpoints, like a customer support call or live chat conversation with an agent.
CSAT surveys are typically sent to customers after one of these interactions. The sooner, the better, since the memory will be fresh in their minds. This is one of the most popular metrics for companies in almost every industry, because the data source is so clear—this is as direct a piece of customer feedback as you can get.
Typically, in your CSAT survey, you’d ask a question like, “How satisfied were you with your [customer support call or whatever interaction you’re measuring]?” Customers pick a score, usually on a scale from one to five.
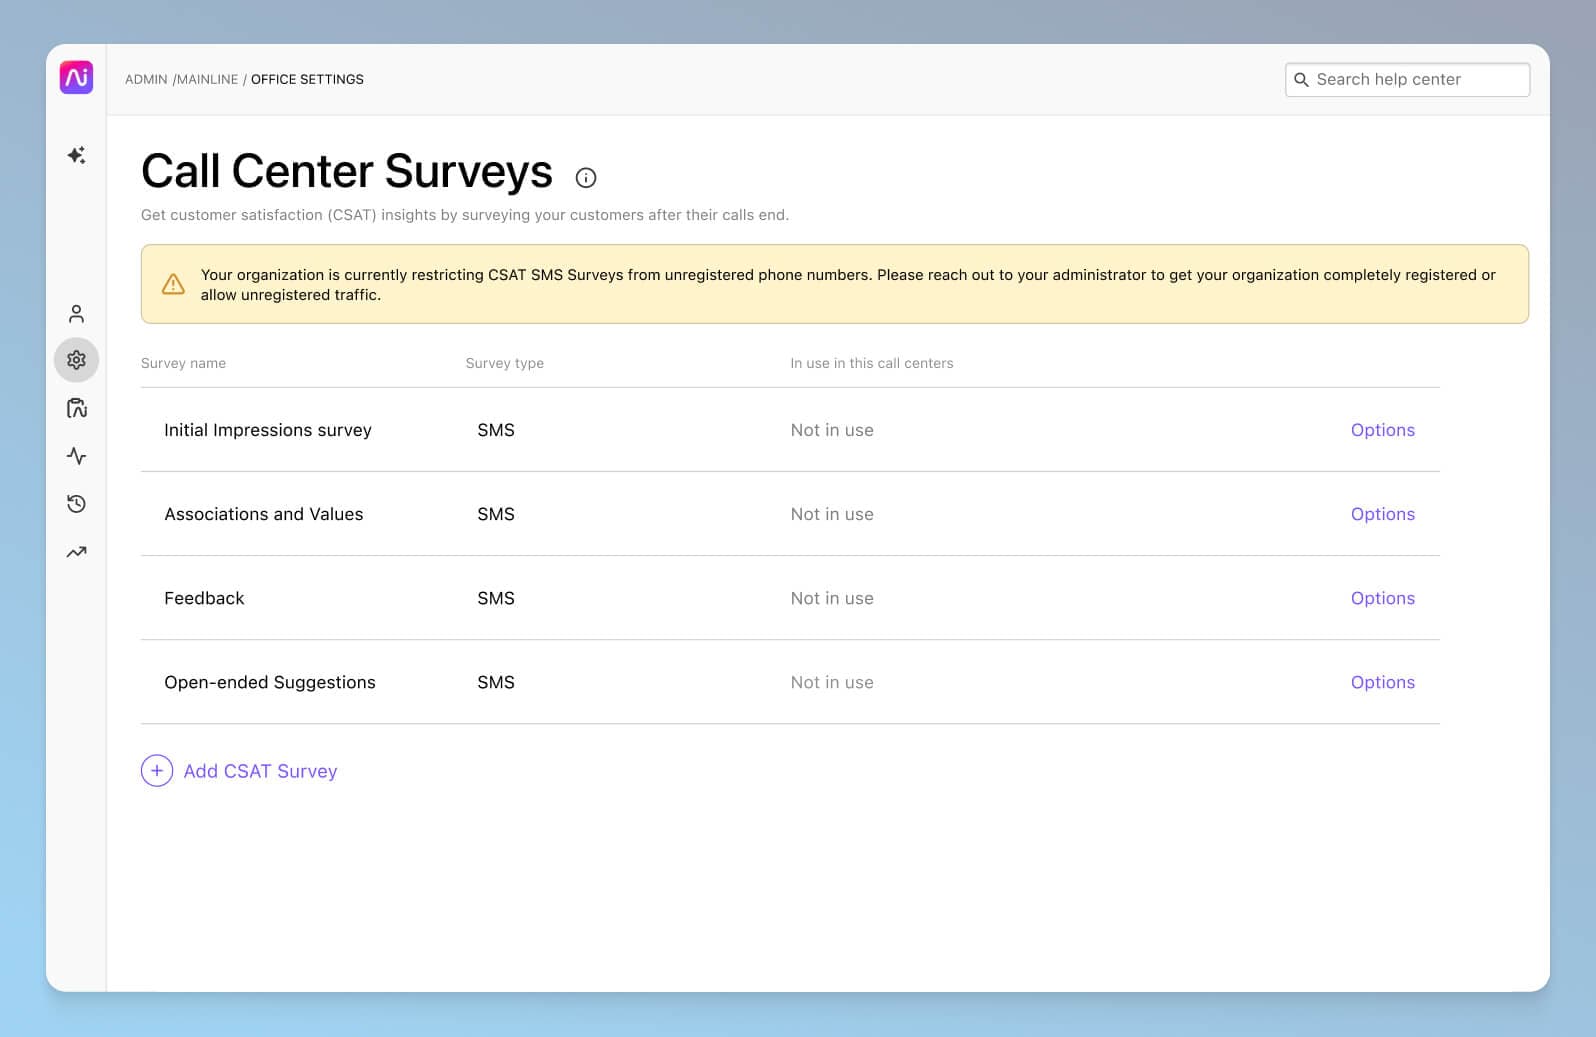
In Dialpad’s contact centre platform, we can set up a CSAT survey in just a few clicks:
The thing is, not a lot of customers actually fill out customer surveys. In fact (depending on the industry and specific business of course), we've found that on average only about 5% of customers actually fill out CSAT surveys. And usually only the angriest—and happiest—customers actually bother to respond to these surveys, which means your CSAT scores are likely to be very skewed and not representative of how your customers feel overall.
So, what can you do? Dialpad's industry-first Ai CSAT feature is actually designed to solve exactly that. Not only can our Ai transcribe calls and analyse sentiment in real time, it can also infer CSAT scores for 100% of your customer calls thanks to its hyper-accurate transcription and predictive analytics. The result? A much more representative sample size for CSAT scores, and a more accurate understanding of how satisfied your customers really are:

It’s a whole new way of gathering customer intelligence.
2. Net Promoter Score (NPS)
Your NPS measures your customers' willingness to recommend your business to someone else based on their experiences. The survey usually consists of just one question: “On a scale of zero to 10, how likely are you to recommend us to a friend / colleague?”
Those who give a score of nine or 10 are classed as “Promoters.” These are your most loyal customers. Those who award you a seven or eight are “Passives”, who have neutral feelings about your brand—but could be encouraged into the Promoter category with a little work.
At the other end of the scale are the “Detractors” (scores of zero to six). These are the customers who will actively tell other people not to do business with you—usually because they had a negative experience. A high number of Detractors = bad news.
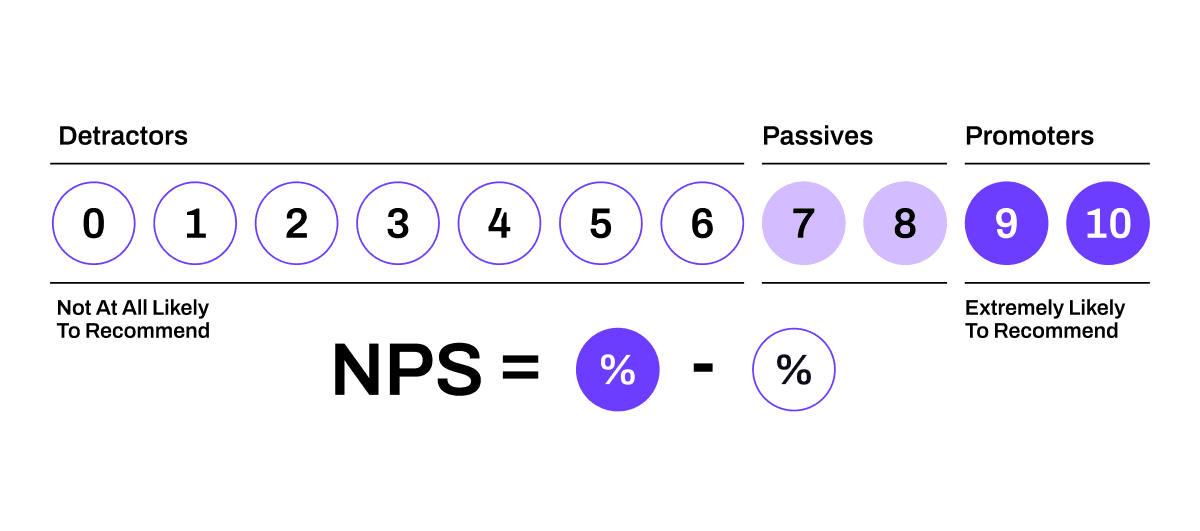
(The industry standard for Net Promoter Scores ranges depending on which industry you’re in, so do a quick Google search to find the general acceptable range for yours.)
3. Customer lifetime value (CLV)
Another essential metric when you’re looking at customer experience analytics is CLV, which we touched upon earlier. It’s important to know your CLV because it reveals who your highest-value customers are—and helps you prioritise them with, say, a VIP call queue if they ever need help.
To calculate CLV, use this formula:

4. Customer Effort Score (CES)
The customer effort score gives you another lens through which you can evaluate your customer experience, by helping you measure how easy it was for a customer to accomplish what they wanted to do when they contacted you.
For example, did their problem get resolved in one conversation, or did they have to call you several times? Were they able to use their preferred communication method thanks to your omnichannel customer service offering?
Typically, you’d send customers a survey that asks them to rank how easy a certain experience was on a scale of one to 10. As with CSAT surveys, it can be helpful to add supplementary questions that dig into the reasons behind the scores for extra insight.
To calculate the CES score, add the total number of customers who gave you a score of five or higher, and divide it by the total number of participants in the survey. The lower the CES, the less effort they had to put in and the easier that experience was for them.
5. Churn rate
We’ve already talked about how it’s important to reduce customer churn, so now let’s look at how to calculate it. Customer churn is a measure of how many customers stop doing business with your brand, over a specific period of time:
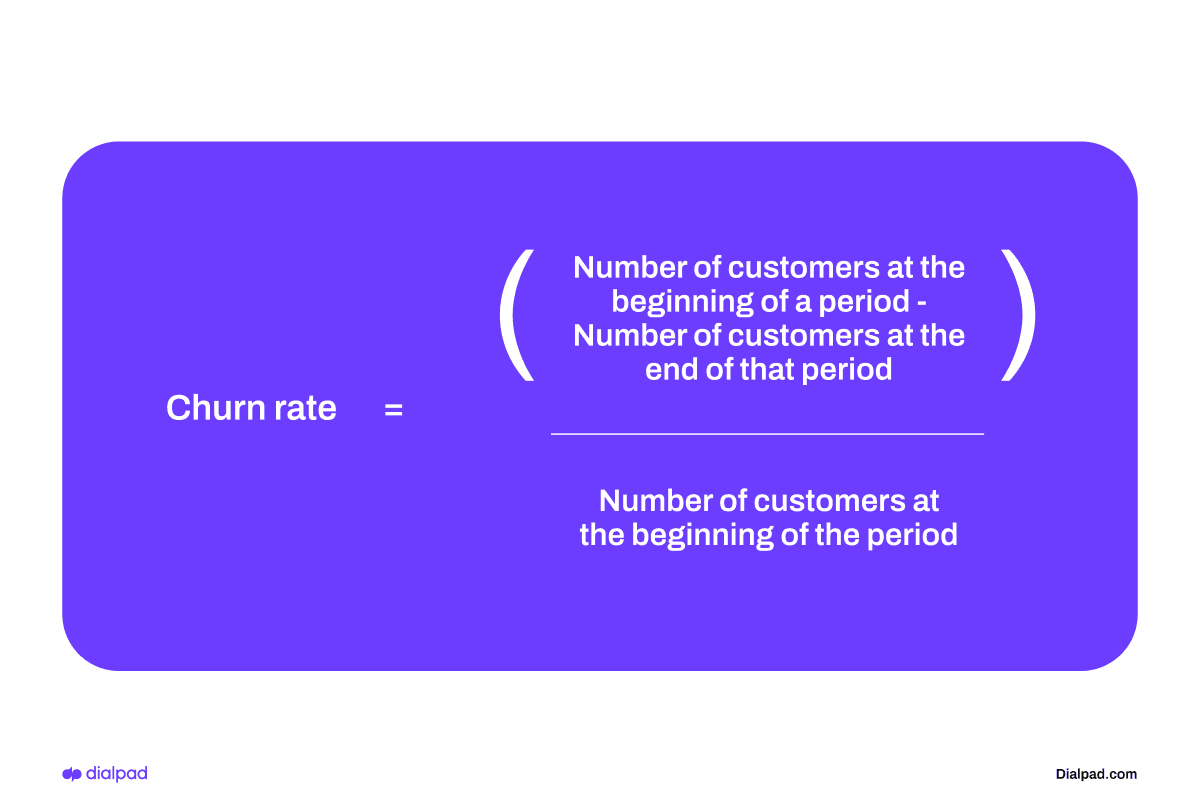
Obviously, the lower this figure is, the better. It’s also possible to achieve negative churn, which is when new revenue from your existing customers is greater than the revenue you lost from customers leaving or downgrading their accounts.
6. Qualitative customer feedback
As well as metrics and your usual contact centre analytics, it’s also helpful to look at qualitative data. Specifically, I’m talking about what your customers are actually telling you.
You could find this information in your customer support tickets, open-ended responses in surveys, social media messages, and call transcripts.
For example, because Dialpad Ai Contact Centre transcribes our customer calls for us and provides a searchable transcript after, we can verify not only if customers are commenting about things like pricing or a new feature we just launched—let’s call it Feature X—but also what they’re saying about it.
This type of feedback is great because it can directly help improve your agent training and onboarding. Say I want to see what exactly customers are saying about Feature X. I can just create a “Custom Moment” in Dialpad to track how often Feature X gets brought up in our analytics dashboard:
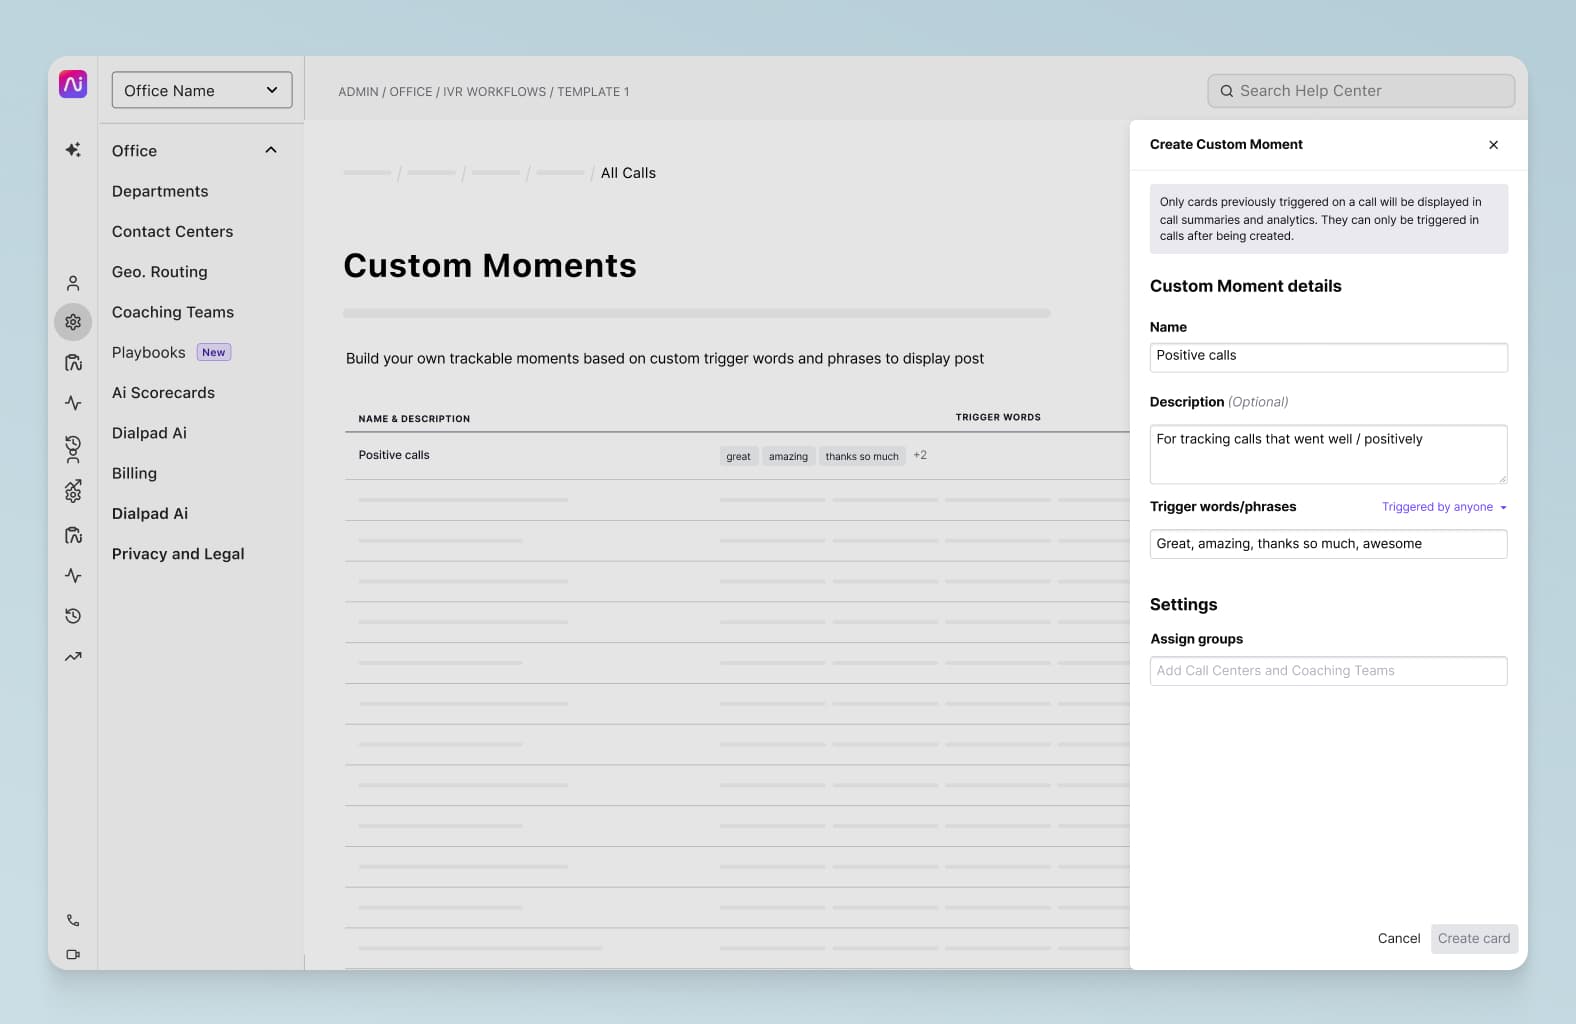
If I notice any unusual patterns, I can then dig into the transcripts to get more context into those conversations. For instance if I see that customers are most often interested in how to set up Feature X, I can then create a Real-Time Assist (RTA) card with talking points on setting up Feature X, and set it to trigger on agents’ screens every time Feature X is spoken on a call:
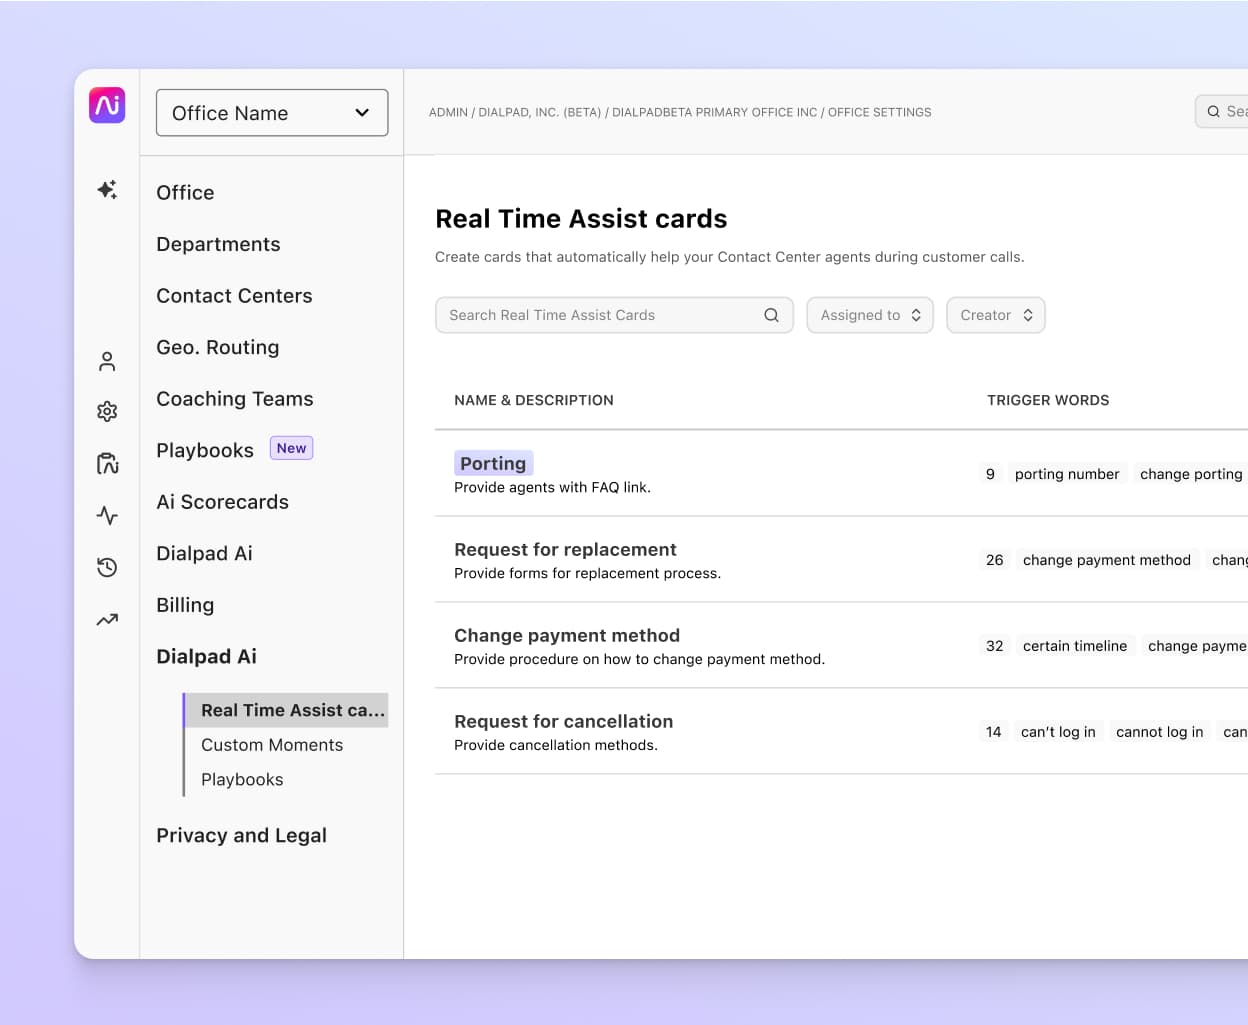
This is just one example of using qualitative customer feedback to improve your customer experience!
Customer service channels to monitor
Every interaction is a chance to collect data and every communication channel has its own customer expectations and nuances, so you should be measuring all the channels your business uses for customer service.
This way, you’ll be able to spot any potential bottlenecks and gain actionable insights specific to each channel.
Phone
Despite so many other channels being available, many people still prefer to contact businesses via phone—especially older customers.
As well as being more personal, it can save time because there’s no back-and-forth like there is with email or messaging. If you need to backtrack more details from the call, recording phone calls is also an option.Many people still perceive the phone to be more secure for things like bank transactions and legal matters too (though this may not be true anymore).
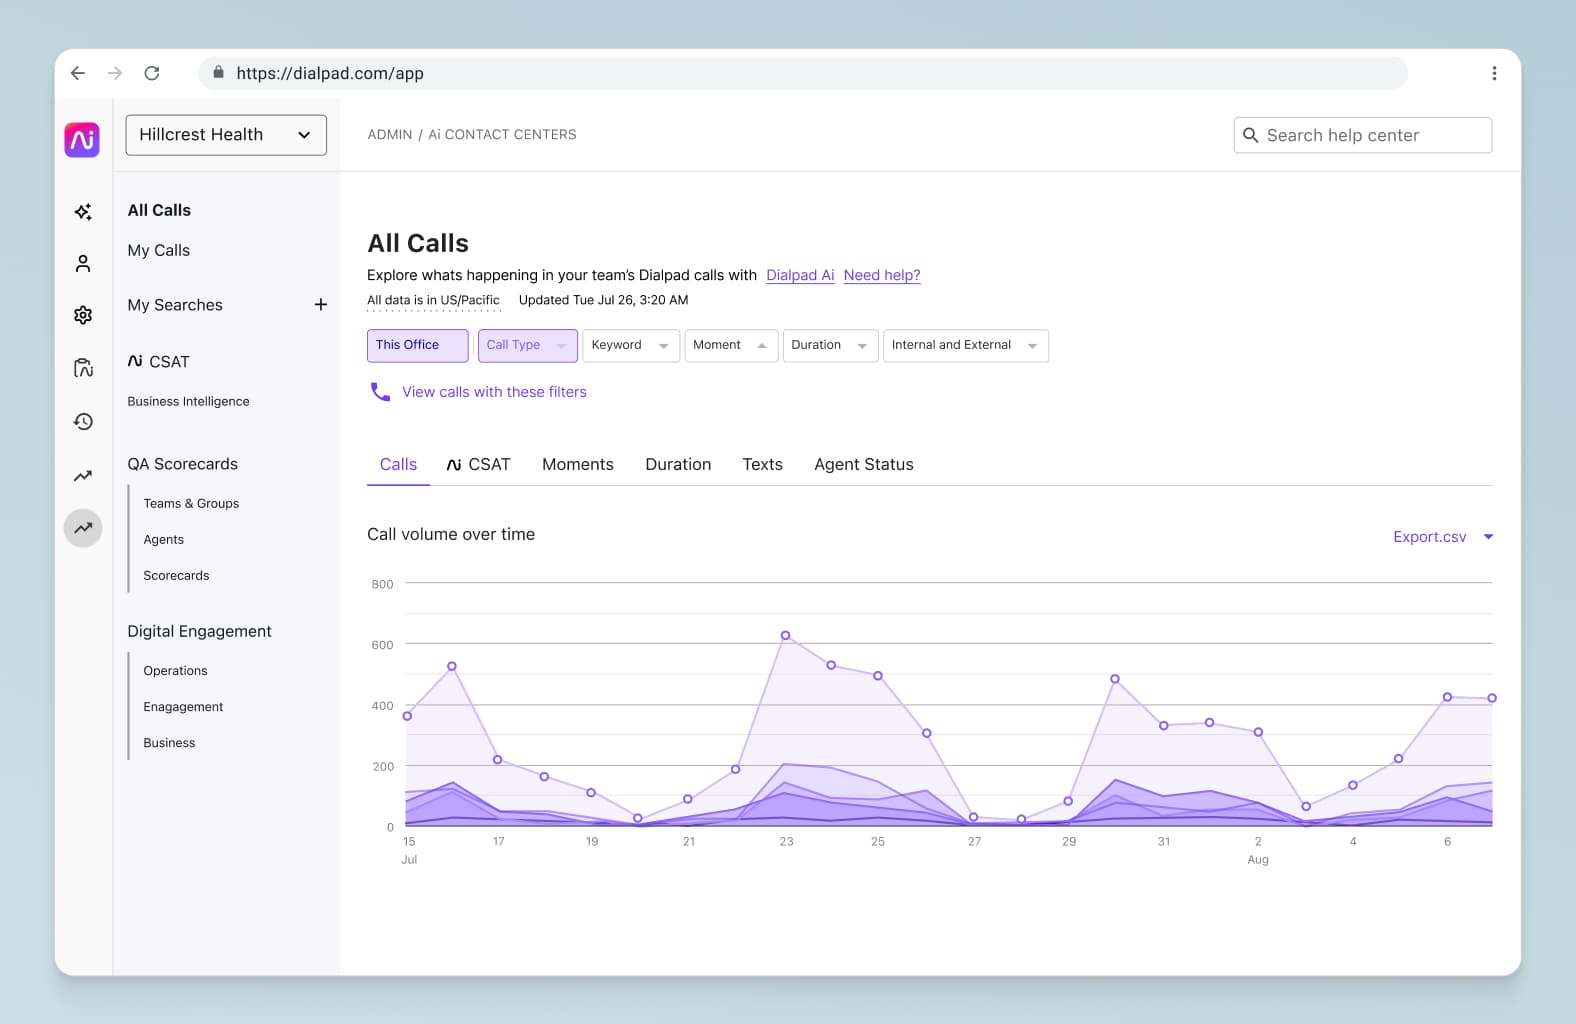
Metrics to measure here include hold times, average speed to answer, average response time, and first contact resolution.
Again, we use Dialpad’s built-in analytics dashboard to monitor our call times, wait times, service levels and so on:
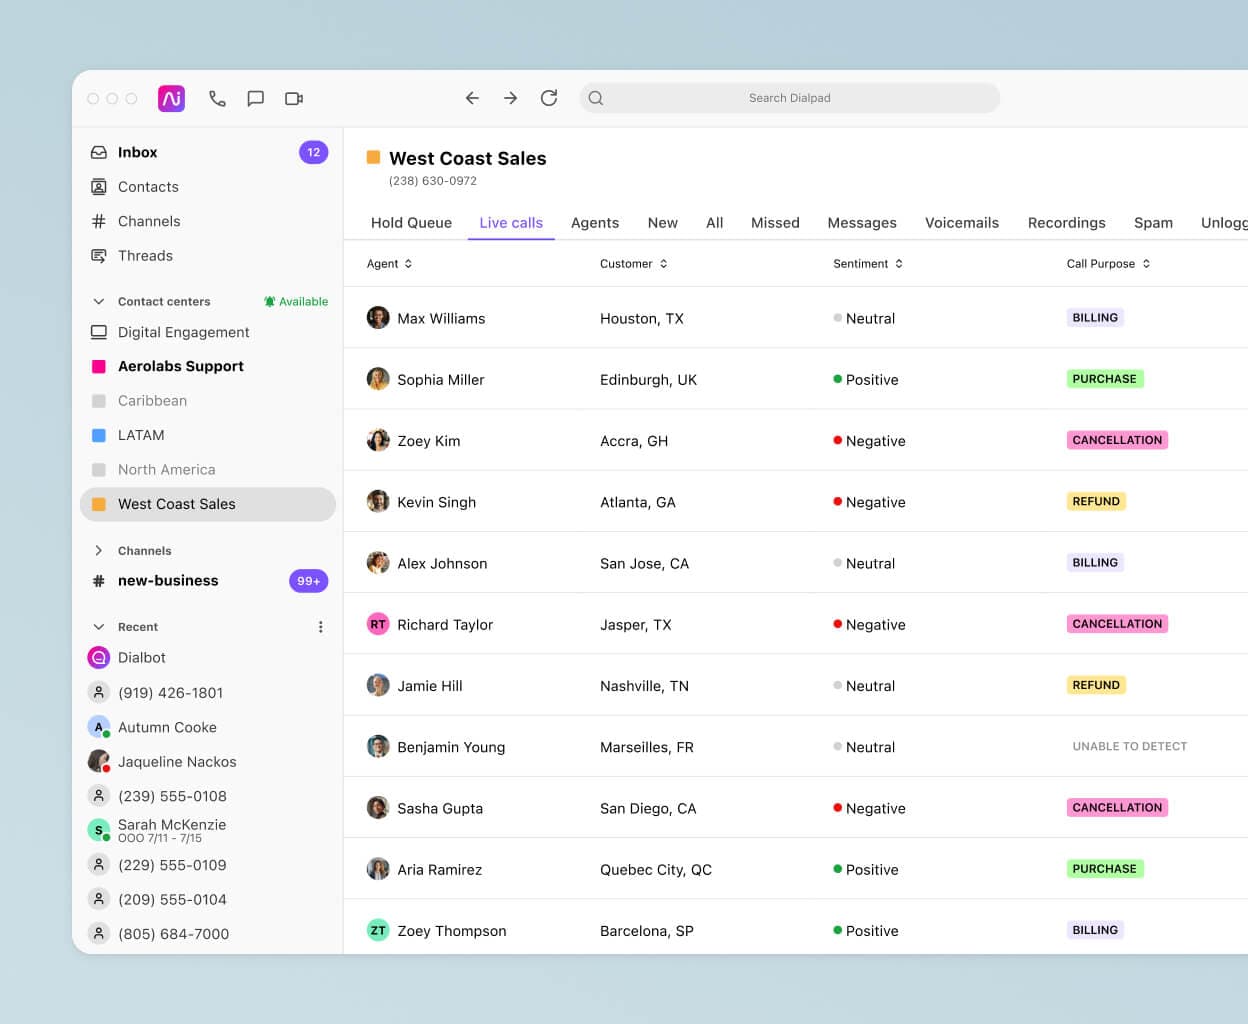
Dialpad’s AI-powered real-time speech analytics are also handy here, as it can show us live sentiment for all active calls. If a supervisor is overseeing a large group of agents, this is great because you can easily see at a glance if a call is going south and jump in to help if needed:
Live chat
Live chat is becoming more and more popular today—and not just by the younger demographics. It’s way faster than email, and can be more convenient than the phone because you’re just at your computer or on your phone instead of waiting on hold.
Whether the live chat on your website is operated by human agents or a support chatbot, it’s a good idea to measure things like average speed of response, whether questions are being resolved or escalated, and so on. This is a great place to include a CSAT survey to get some qualitative feedback on whether your strategy for this channel is working.
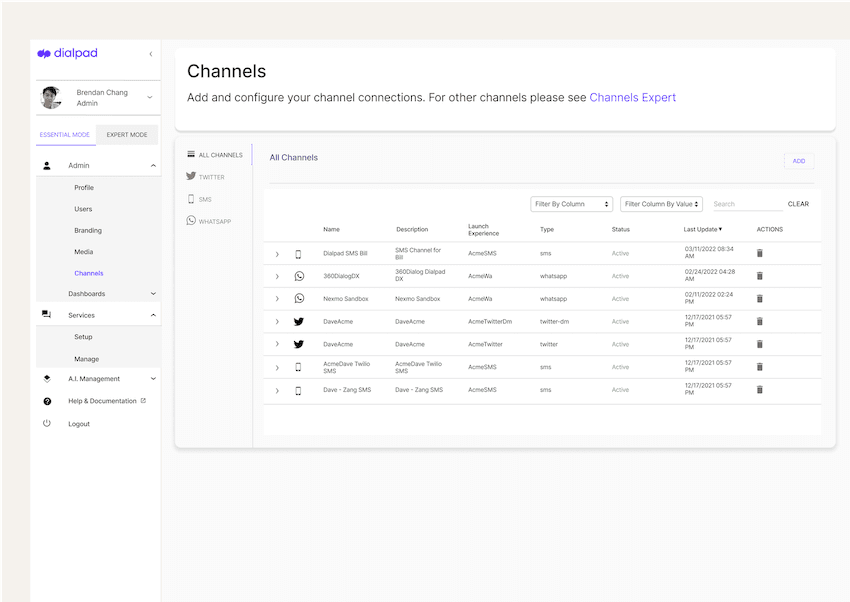
If you’re interested in adding live chat to your support channels, consider an omnichannel contact centre platform that comes with this channel included. For example, in Dialpad, our agents can handle voice calls, SMS/MMS messages, social media conversations, and live chats with customers—all from the same app:
Self-service portals
When it comes to self-service, you could have a chatbot on your website, an FAQ page or online knowledge base, video tutorials, a good IVR menu... There’s a pretty wide range of options you could use to deflect calls and messages to your agents.
The thing to remember with customer service automation is to not overdo it—don’t try to remove humans altogether from your customer service options. Sometimes, people just have more complicated questions and need to talk to someone. Don’t make it overly difficult for them to do that. Otherwise, you’re sacrificing your customer experience.
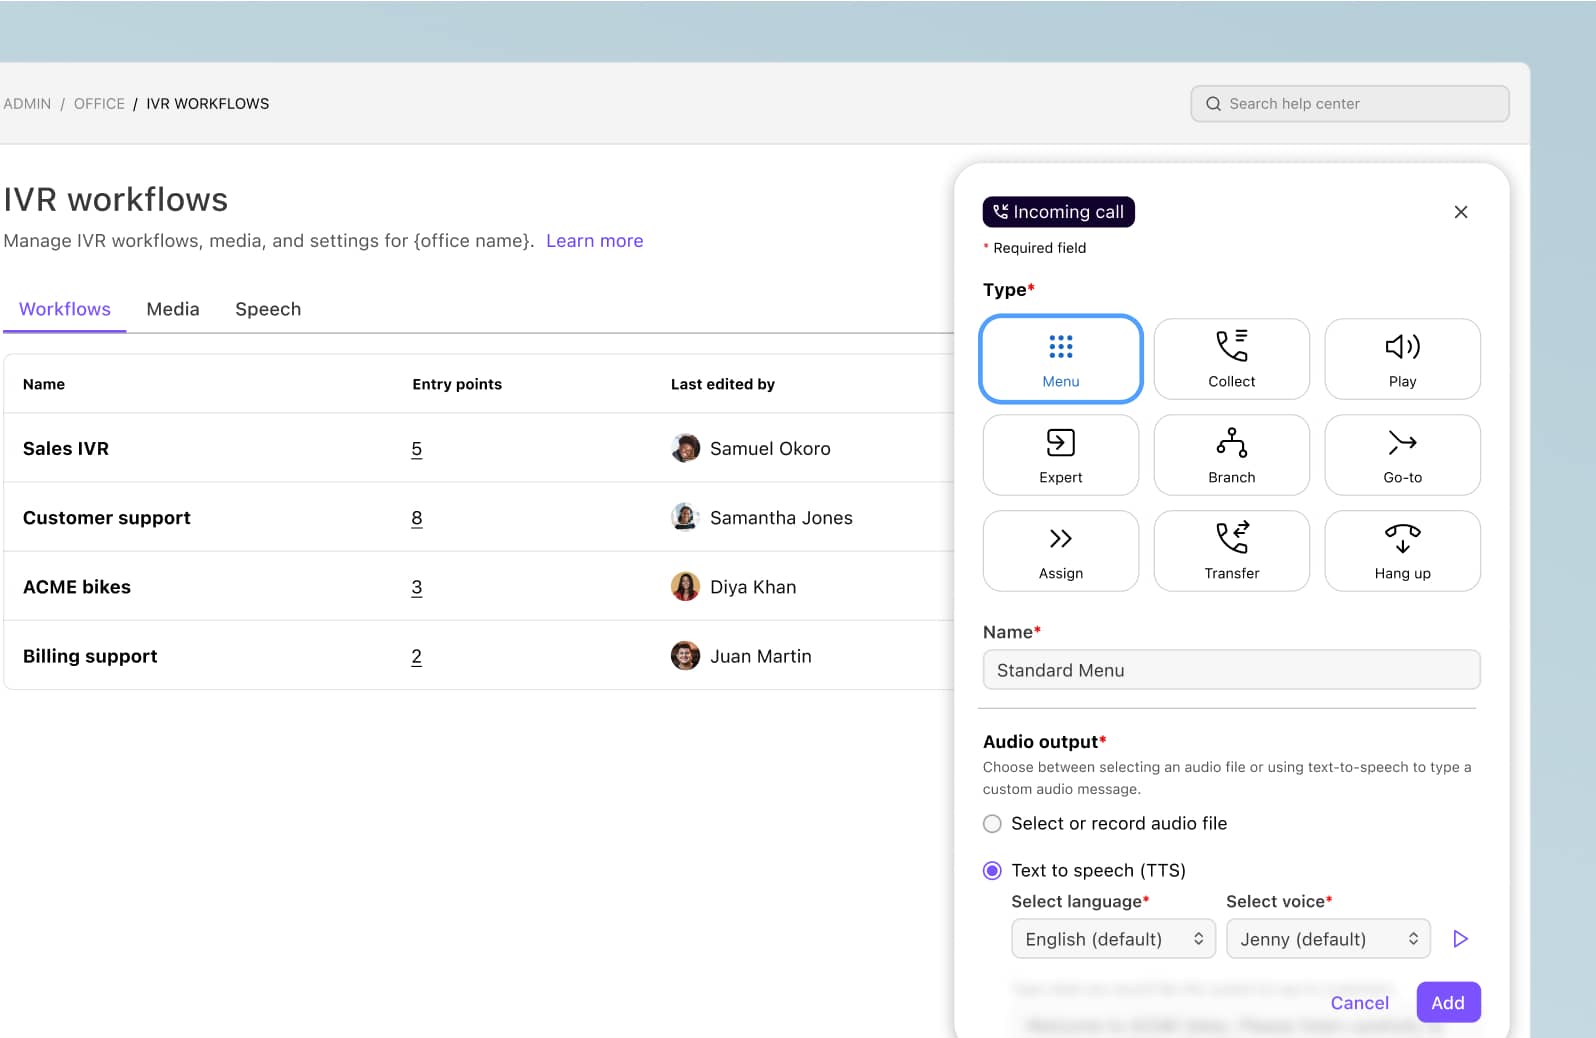
With self-service, you can measure things like the number of thumbs up or thumbs down that your FAQ articles get, how many call deflections your chatbot achieved, and if you have an IVR menu, Dialpad also has built-in analytics that show you how frequently each of your IVR options are being used by callers, so you can decide if any of them should be dropped or adjusted:
Social media
Because social media is so popular and interactive, it’s a great way to build closer relationships with customers and foster a sense of community.
People tend to use social media channels to reach out to businesses because they expect it to be fast, so quick responses to questions or comments are important. If you’re finding that your response times are slow, then you may need a separate agent or team to deal with your socials.
👉 Where’s email?
You might notice a big communication channel that’s missing on this list: email. Even though email has always been a core customer service channel, more and more companies are moving away from using it because they can provide support much more quickly through other channels like live chat and even SMS text messaging.
Get a better understanding of your customer needs with customer service analytics
As we’ve seen, customer service analytics can provide supervisors and businesses with a wealth of valuable information, including not only what your customers expect from you, but also how well your support team is performing, and whether that translates into customer loyalty and retention.
The biggest challenge with analytics is gathering it and being able to make sense of huge amounts of data. Ideally, your help desk software or contact centre platform will come with business intelligence features and integrations with your other software to sync this data and make it accessible to everyone.
(Dialpad integrates with Playvox, Zendesk, Salesforce, and a ton of other customer service software—and saves our own team hours every week.)
If you’re looking for a communications platform that not only lets your agents handle high volumes of customer conversations, but also gives you insight into performance, why not see how Dialpad Ai Contact Centre works?
Get a walkthrough of Dialpad Ai Contact Centre
From the call analytics dashboard to the heatmaps and omnichannel communications management, Dialpad's cloud contact centre platform is designed to help customer service teams keep customers happy. See how it works with a demo, or take a self-guided interactive tour of the app on your own!


