8 essential metrics for contact center reporting

Customer Support Manager - Tier 1
Tags
Share
As a manager or supervisor, contact center reporting is one of your most important tasks.
It’s crucial for measuring contact center performance, empowering agents to do their best work, and keeping stakeholders and execs informed on a regular basis.
But with so many possible metrics, historical reports, and insights to keep track of, what’s the best way to do this reporting?
In this guide, I’ll provide some tips and other best practices I’ve learned from leading our Tier 1 Customer Support team, how we use our contact center platform to do this reporting, and more.
But first, what exactly is contact center reporting?
Contact center reporting: More than just analytics
Contact center reporting is essentially the process of turning raw data (both real-time and historical data) into useful, simplified summaries like performance reports and key performance indicators, or KPIs.
The goal of doing this is to improve not only your customer experience but also agent performance. Beyond customer satisfaction levels, your reporting can—and should—also look at agent activity or how individual agents are performing.
From there, you can compare against industry benchmarks and use this information to inform your strategic goals
👉 Contact center reporting vs. call center reporting:
They’re pretty much the same thing, but technically, call center performance is more about inbound and outbound calls. Contact center teams have to manage digital channels like live chat and social media as well, so that reporting is generally more complex.
Common reporting mistakes that contact centers make
Whether you’re using templates or building custom reports, there are a few mistakes that I’ve seen many businesses make (that are easily avoidable) when they’re gathering or monitoring call center metrics. Here are the big ones.
Getting overwhelmed with KPIs
When you were looking at how to start a contact center, did you scour the web for advice on the key metrics you should be tracking?
On the basis of your research, how many “essential” KPIs did you end up with? Five? 10? 50?
I think we’ve all made the mistake of overwhelming ourselves with too many metrics and KPIs. Not every contact center needs to report on the same set of metrics. Sure, there are a few common metrics that almost everyone, regardless of industry, should be tracking (more on this below), but not everyone tracks agent performance in the same way, for instance.
Bottom line: Know the metrics you need and make sure your contact center analytics dashboard can give you that information in real time if needed.
Not using a robust analytics and reporting platform
There are a ton of optimization and reporting tools out there.
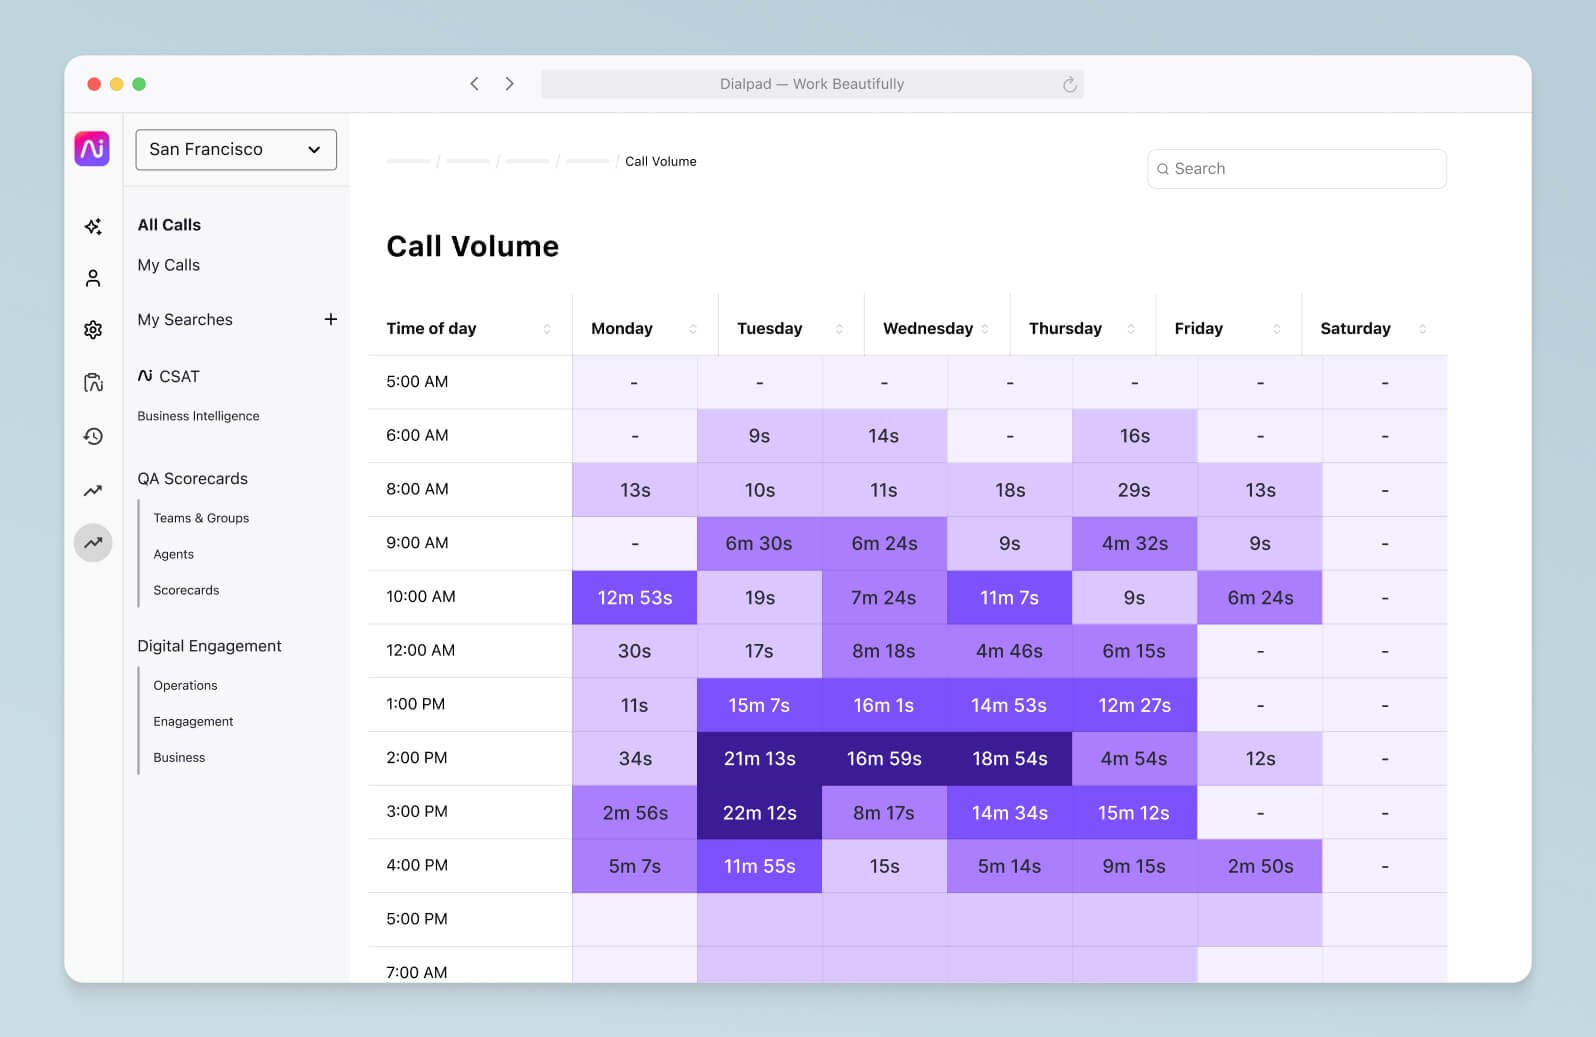
But for most businesses, a good piece of contact center software should be able to cover your major custom reporting needs. For example, we use Dialpad’s omnichannel contact center platform, which comes with a ton of built-in analytics that show us everything from general call center analytics like missed and abandoned calls...
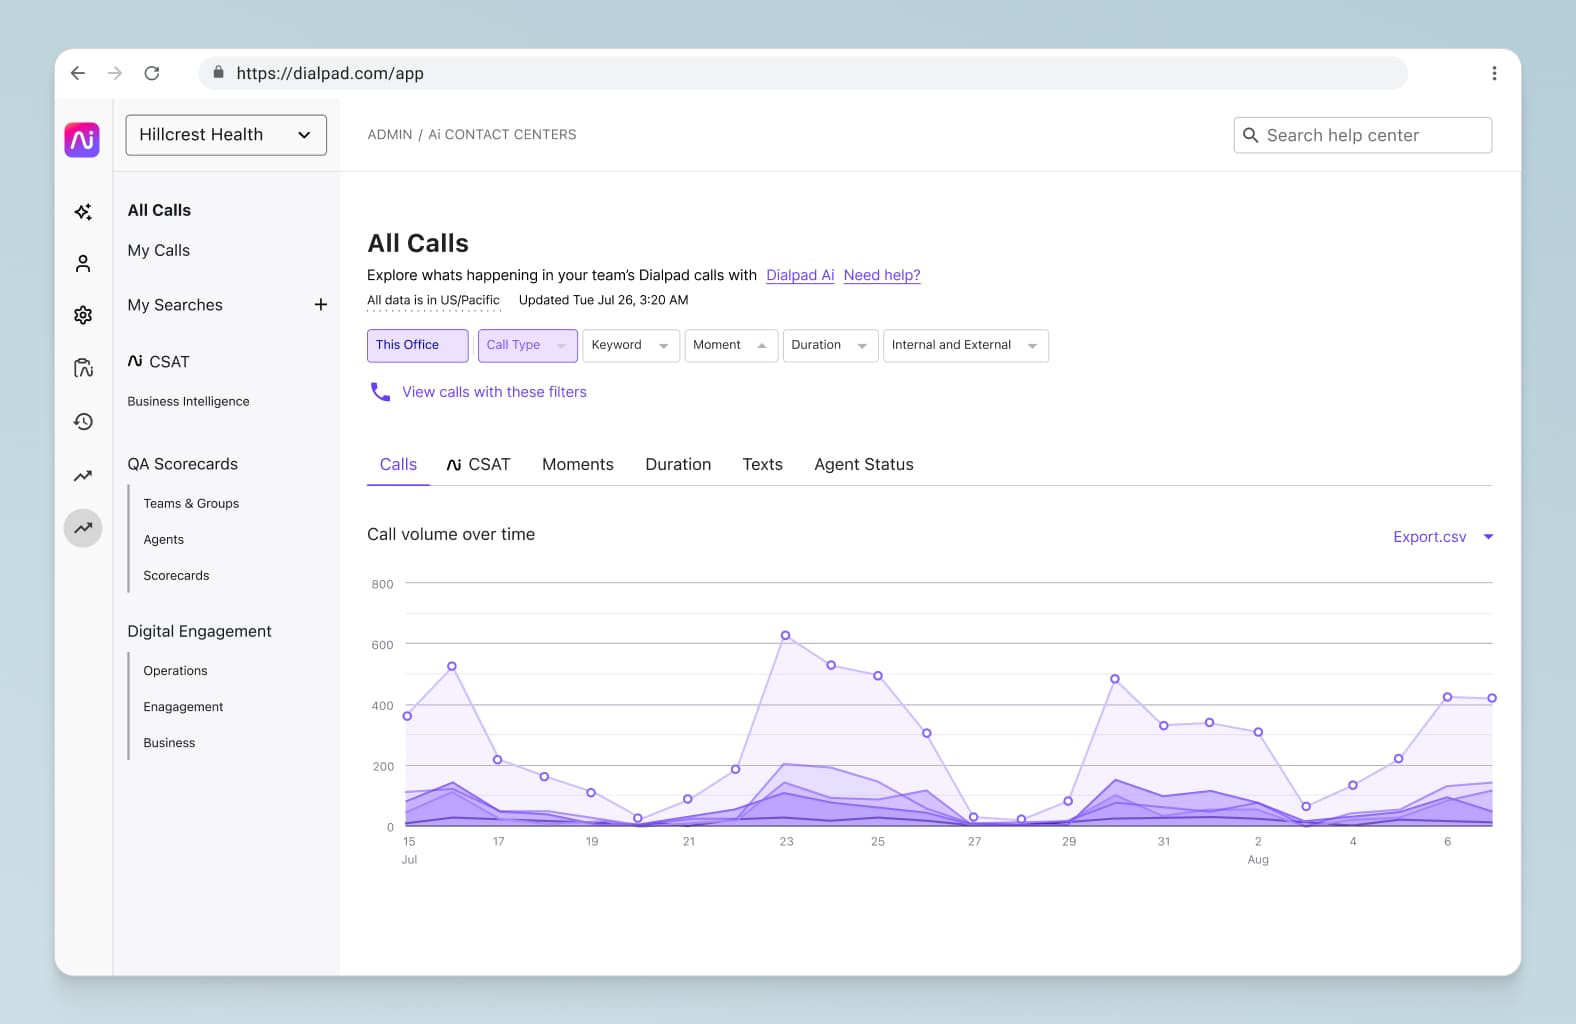
... To how often our IVR menu options are being used by callers, and heat maps that show us call volume patterns and average speed to answer:
Not only that, Dialpad Business Intelligence also lets us build very robust custom reports for more advanced workforce management:
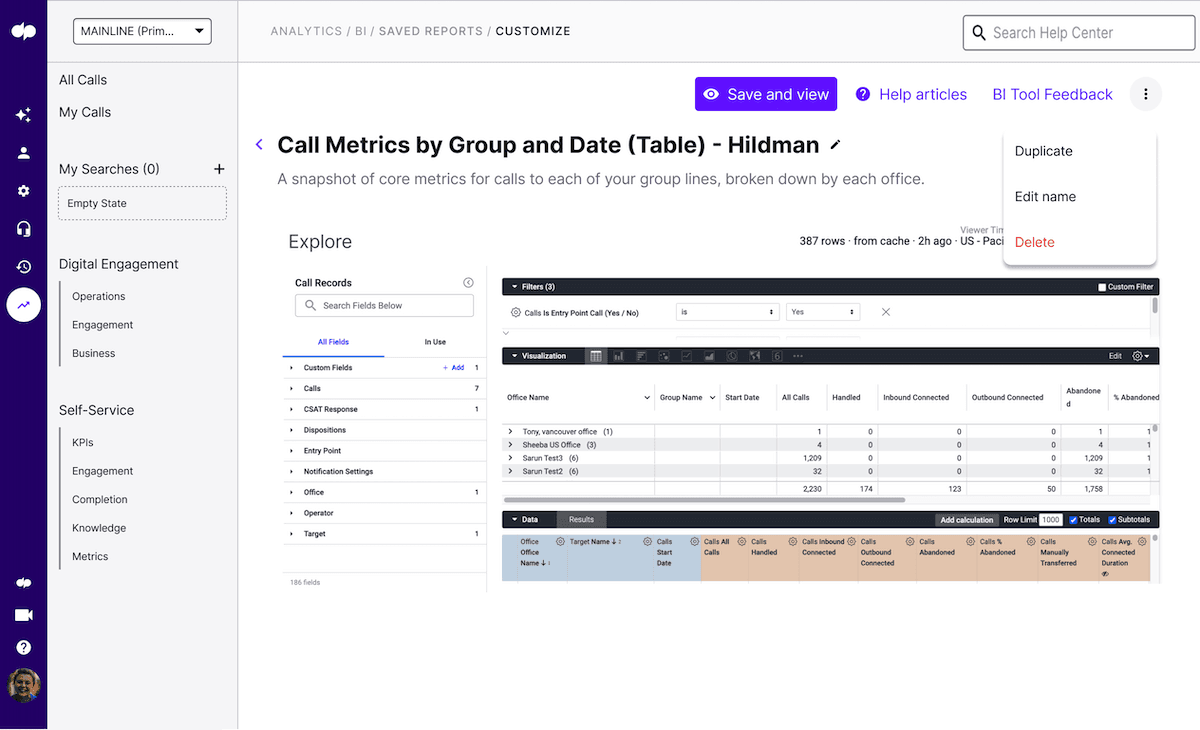
And all of these analytics tools are built right into Dialpad, no third-party add-ons or integrations needed.
Looking at metrics in a silo
Another common mistake is looking at a concerning KPI on its own, devoid of context.
If you look at any one number on its own, it can look alarming. But you might find that in the big picture, it’s not actually a problem.
For example, let’s say your call handling times went up by 10%. Bad, right?
But what if, over the same period, your customer satisfaction scores went up by 45%? Digging deeper, you might find that your agents are spending a little more time with customers, but resolving their issues much more effectively. And maybe that tradeoff makes sense for you.
Always look at metrics with the big picture in mind.
8 contact center metrics and KPIs to know
1. Customer satisfaction
Customer satisfaction (CSAT) scores are probably one of the most popular KPIs in contact center reporting. It usually measures how happy your customers are with a specific interaction with your business, and CSAT scores are obtained through customer feedback surveys sent immediately after a customer finishes a chat or call with your support team.
They’ll usually be asked to rate their customer experience out of either five or 10. The higher the rating, the more satisfied the customer.
In Dialpad’s contact center platform, we can create CSAT surveys with just a few clicks:
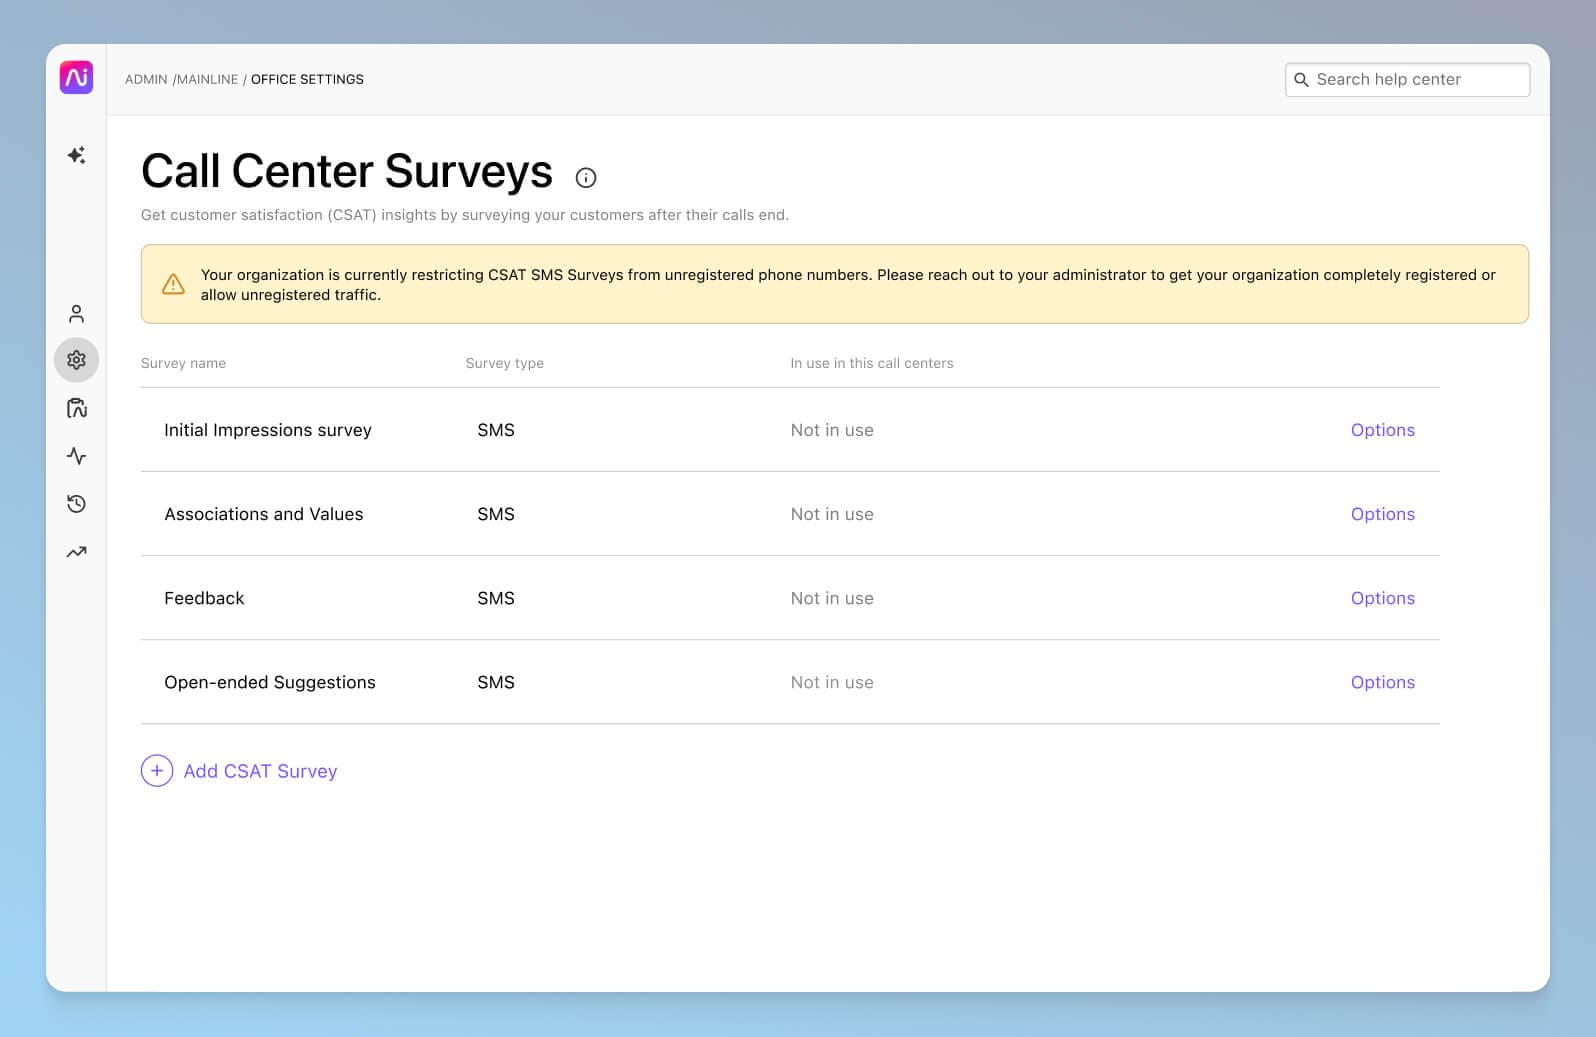
One of the biggest challenges with CSAT scores, though, is that not a lot of people actually fill out those surveys.
In fact (depending on the industry and specific business of course), we've found that on average only about 5% of customers actually fill out CSAT surveys. Plus, usually only the angriest—and happiest—customers actually bother responding, which means your CSAT answers are likely to be very skewed and not representative of how your customers feel overall.
Dialpad's industry-first Ai CSAT feature is designed to solve exactly that. Not only can our Ai transcribe calls and analyze sentiment in real time, it can also infer CSAT scores for 100% of your customer calls thanks to its hyper-accurate predictive analytics and transcription feature. The result? A much more representative sample size for CSAT scores, and a more accurate understanding of how satisfied your customers really are:
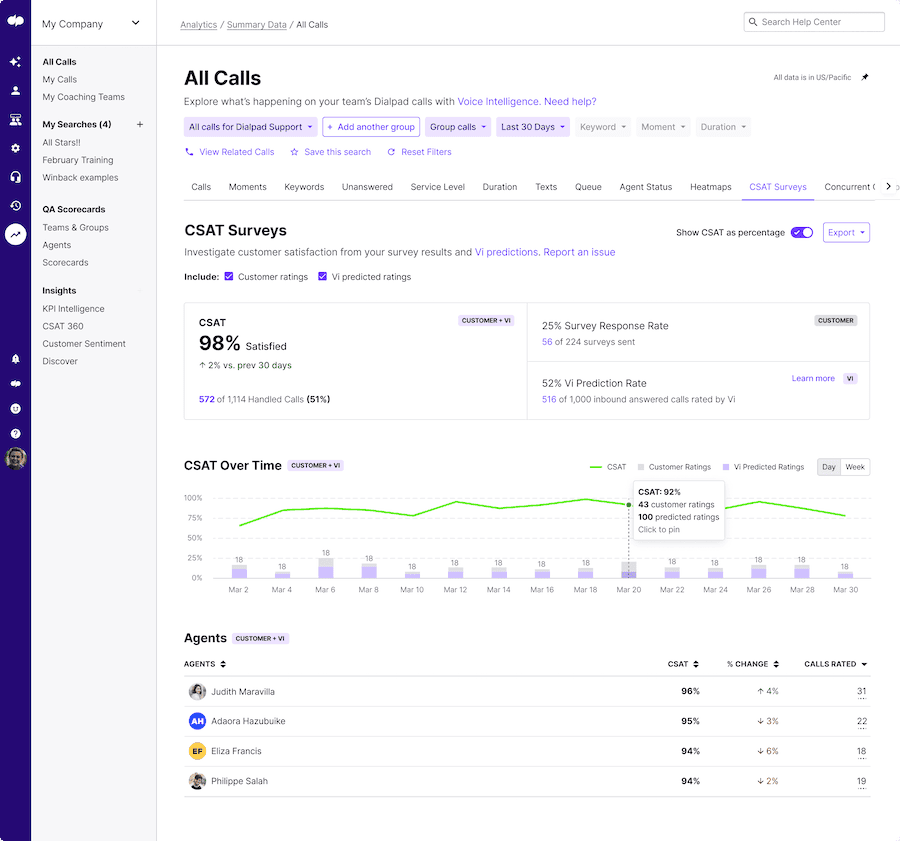
And that’s just one example of what contact center AI can do. There are a ton of other automations that Dialpad Ai does for us—like live sentiment analysis, which helps busy supervisors like me keep an eye on multiple active calls at once in case a conversation goes south.
2. Net promoter score
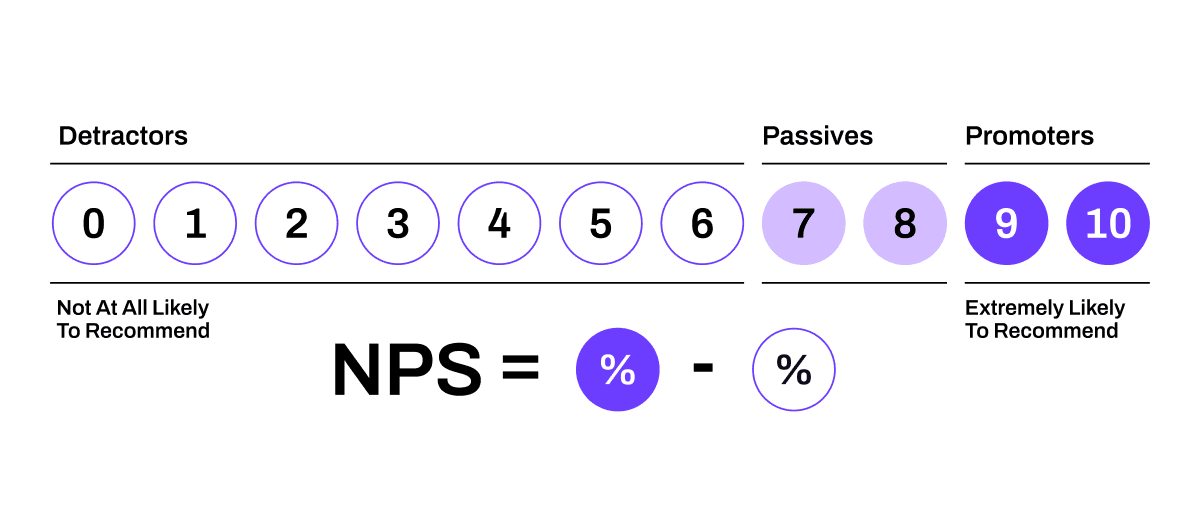
Your net promoter score (NPS) is a way of measuring your customers’ experience in terms of how likely they are to recommend you to their friends or network.
An NPS survey asks your customer one simple question: “On a scale of 0–10, how likely are you to recommend [name of your company or product] to a friend or family member?”
The higher the rating, the more likely they are to recommend you, which means increased word-of-mouth promotion for your business. Basically, free marketing.
Here’s how to calculate your NPS:
3. Customer effort score (CES)
Customer effort score (CES) measures how easy or difficult it is for your customers to do a certain task or solve their problem.
For example, how hard is it for them to reach the right department without getting stuck in a call transfer loop? Or, how easy is it for them to get a refund?
Some of the tasks you measure might involve your call center agents (the first example earlier) or how you’ve set up your ACD or automatic call distributor. Others might be more dependent on your website experience (the second example earlier).
4. Average handle time
This KPI measures agent productivity in terms of how long they spend handling individual inbound calls.
Customers don’t tend to be very patient, and you’ll want to answer their questions as quickly and efficiently as possible. With that being said, it’s the complexity of the issue that determines how long it will take to resolve, which is why average handle time (AHT) should generally be more of a guide than a strict goal.
A sudden spike in AHT can point to gaps in your contact center training. A low AHT might look good on paper, but when coupled with lower satisfaction or resolution rates, it could suggest that agents are rushing to end their phone calls.
5. Service levels
Your service levels are essentially your contact center’s guarantee of service—for example, your service levels might be to pick up least 75% of your inbound calls in under 30 seconds.
Some contact center reporting tools have built-in functionality to help keep you on top of your service levels. Dialpad, for instance, has an automation that pings supervisors when service levels drop below a certain threshold:
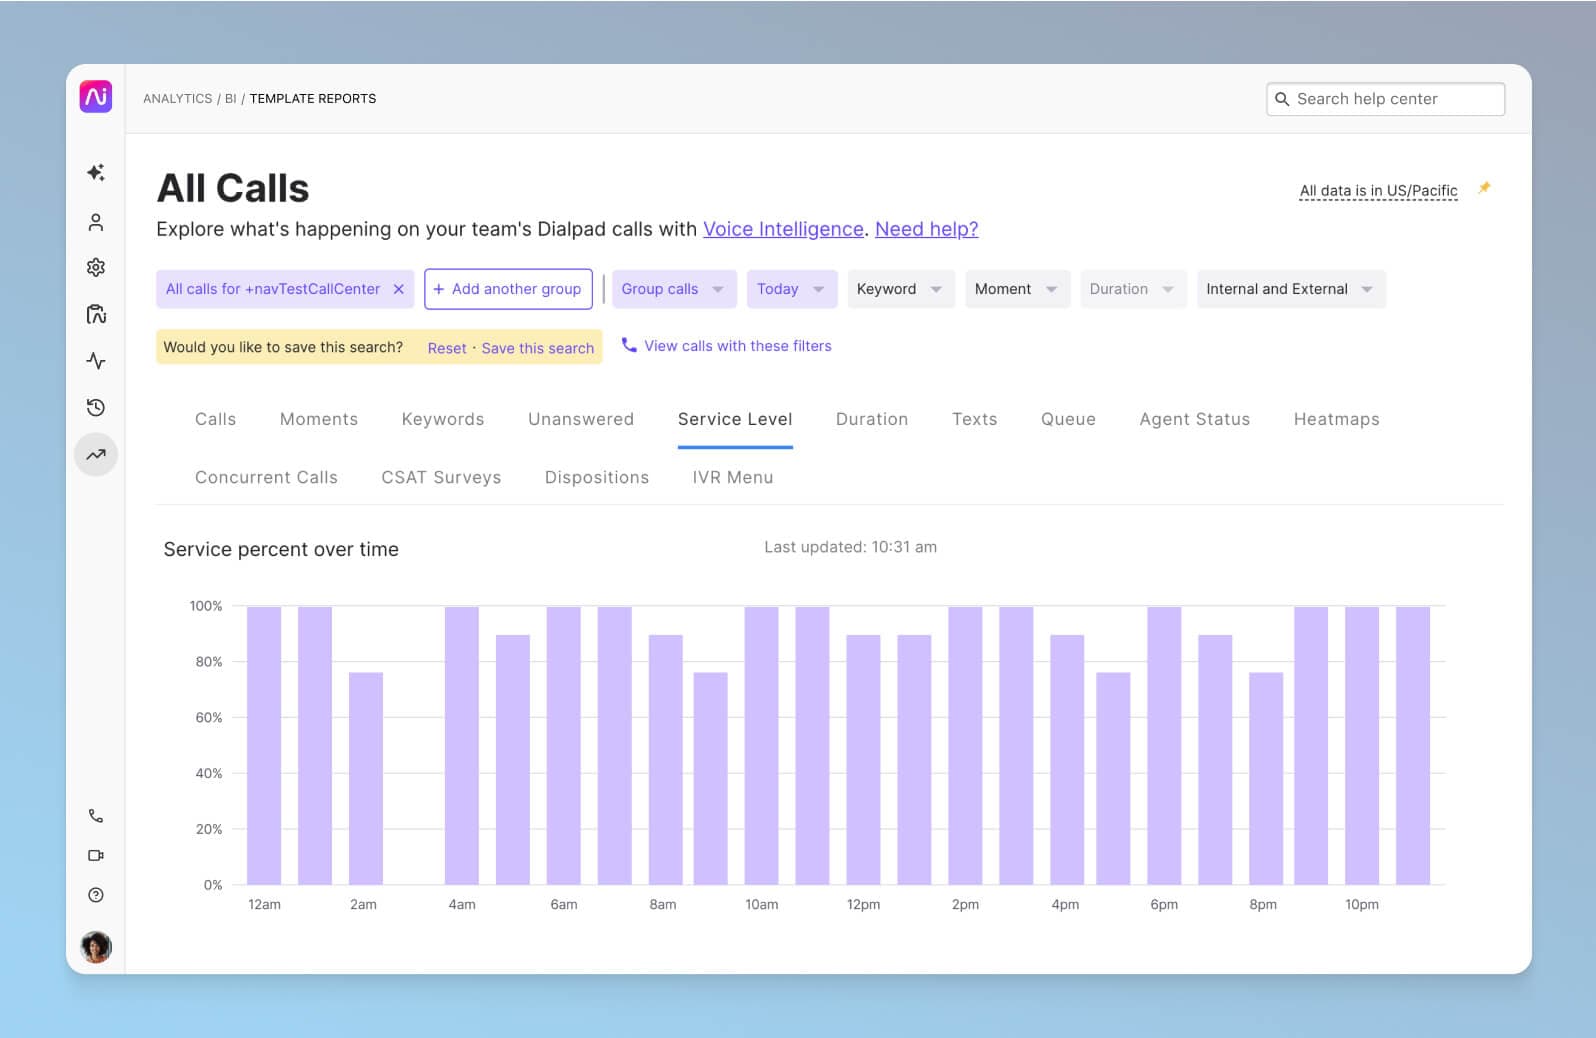
It’s a great contact center management feature for us.
6. Abandonment rate
Your abandonment rate refers to the number of incoming calls that end before they reach an agent, whether that’s during the IVR menu being played or while they’re waiting in the queue.
It goes without saying that you’ll want to have a low abandonment rate, but it’s important to acknowledge that abandoned calls are common for contact centers—it’s impossible to completely eliminate abandoned calls. So, your goal should be more about determining why callers are hanging up to see if there’s anything you can do to lower the rate.
High wait times or hold times are an obvious factor here, but high abandonment rates could also be caused by other factors like unclear IVR menu options.
We actually did a little research into the correlation between hold times and CSAT scores, if you’re interested in learning more about this.
👉 Dialpad tip:
If you have a multichannel contact center, don’t forget to assess your abandonment rate across your other channels, like SMS and instant messaging.
7. First call resolution
Your first call resolution (FCR) rate—more commonly known as first contact resolution today, since there are channels other than phone calls—measures how often a customer reaches out to you and gets their issue resolved on the first attempt.
On a business level, high FCR rates can lower call volumes and reduce operational costs, not to mention it keeps customers happy.
As always, though, there are exceptions and caveats to keep in mind. For example, agents who commonly handle complex issues may have a higher FCR rate, so you’ll want to take this into account when you’re doing reporting and analysis on agent performance.
8. Occupancy rate
Occupancy rate is the percentage of time agents spend on call-related activities. This includes wait times and after-call work like data entry.
A 100% occupancy rate should not be the goal of your call center operations. Unless your agents are literally robots, then 100% occupancy is not realistic—or healthy. It would mean that agents are handling an extremely high number of calls, all back-to-back, from the second they walk into the office to the second they leave. (Even if by some miracle you hit this benchmark, it’s unsustainable—your agent turnover will probably also be very high and morale very low.)
An 80–90% occupancy rate is optimal for most contact centers. You can even lower it to 70–75% depending on your call volumes. Agents should be spending time on other activities alongside calls, like training or simply taking a well-deserved breather!
In your reporting, make sure you set fair and realistic occupancy rates. Data visualizations that relate occupancy rates to call volumes or handling times can help guide your occupancy benchmarks.
Contact center reporting software features to look for
Real-time analytics
First things first, make sure you’re able to gather all the call data you need. Ideally, it’d be through real-time dashboards, which show you easy-to-digest visualizations of things like call volumes, missed calls, abandoned calls, and call durations. Can you build custom reports and get the specific metrics that you’d need?
👉 Dialpad tip:
Instead of purchasing one analytics tool and another piece of call center software, look for a versatile and robust cloud contact center platform that comes with built-in analytics. This allows you to monitor your metrics and also manage your internal and external communication channels in one place.
Integrations with other tools you’re using
Don’t overlook this one. It’s not technically an analytics feature, but you’ll want your contact center platform or reporting tool to integrate with your CRM and other software you’re using.
For example, if you want to monitor contact center performance on a deeper level, Dialpad integrates with Playvox’s workforce management platform for even more advanced staffing, scheduling, and forecasting features.
Security and compliance measures
When you’re handling customer data, you need to double—no, triple—check that you’re abiding by the rules and regulations in your industry.
Dialpad’s contact center has enterprise-grade security, along with custom data retention policies, call recording privacy features (for example, it’ll automatically play a notification to let callers know you’re recording the call), and so on. Dialpad can also help you maintain compliance with HIPAA, SOC Type ll, and GDPR, just to name a few.
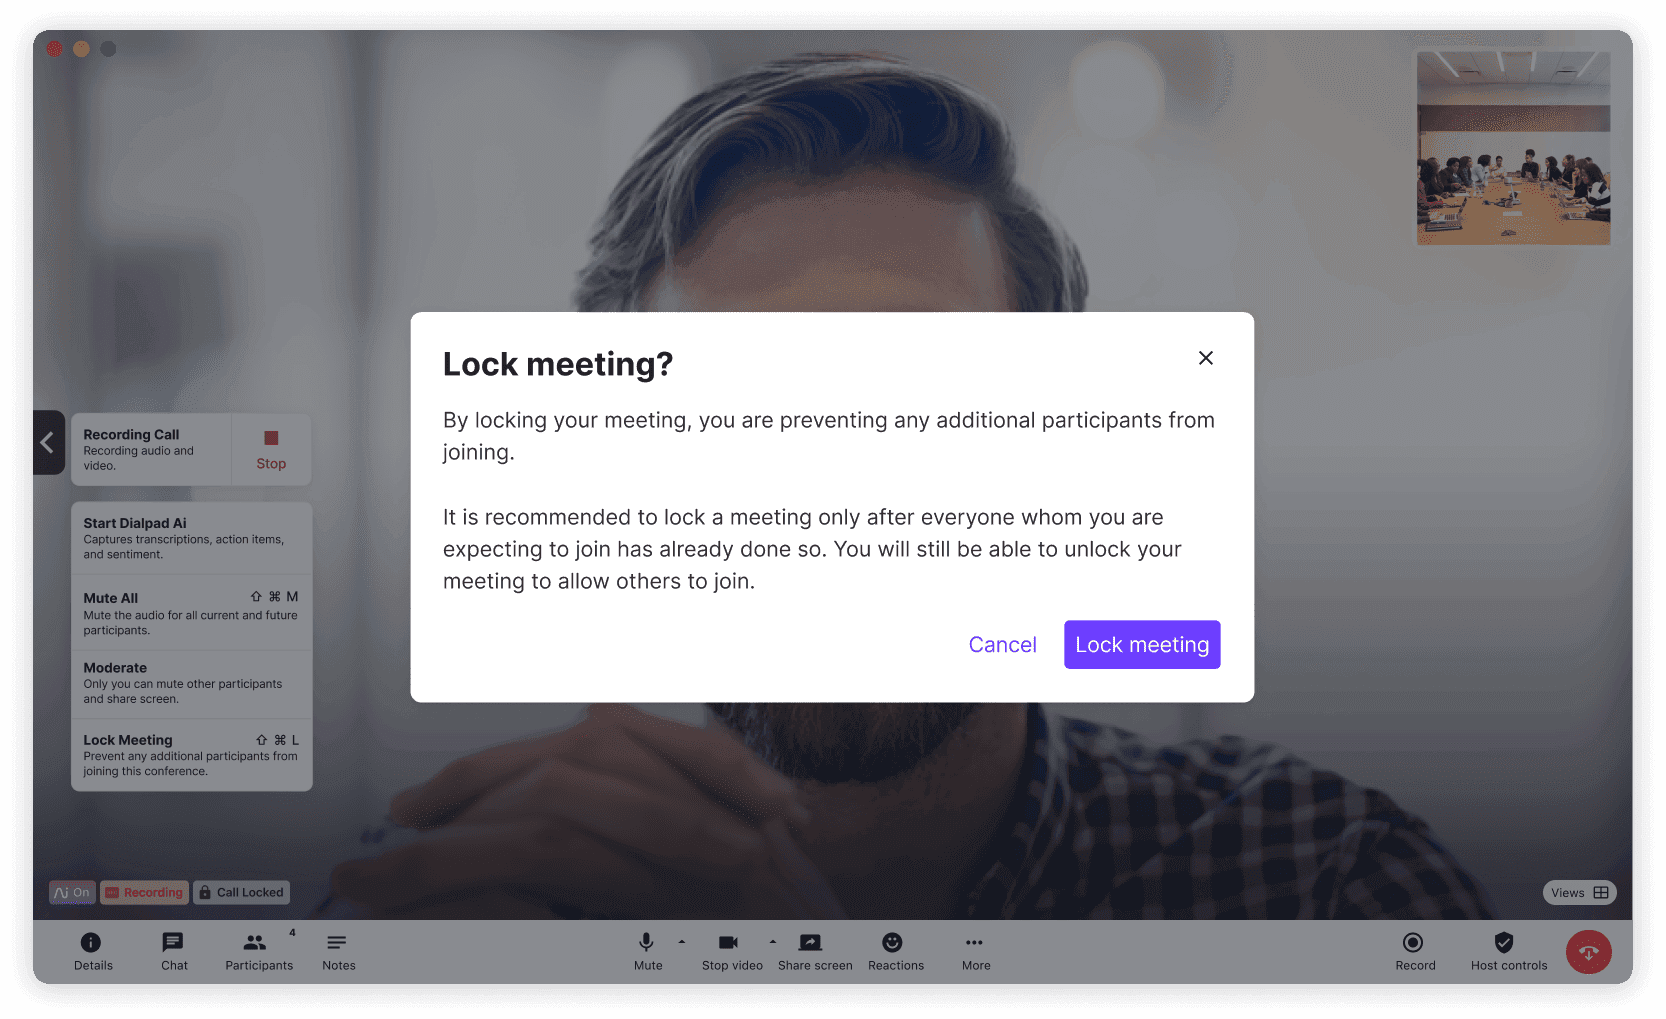
And that’s all in addition to the in-meeting security controls, which lets the host mute and remove guests, block screen sharing, lock the meeting, and more:
Bonus: Real-time transcription and live sentiment analysis
These aren’t your conventional analytics, but having a record of your customer conversations can be very helpful.
Dialpad’s built-in AI technology can transcribe both voice calls and video meetings in real-time:

And Dialpad Ai doesn’t just transcribe conversations—it can analyze the sentiment of a call too. Supervisors can easily monitor multiple active calls and quickly see if a conversation is going south. If so, they’d just open up the real-time transcript to get more context, as the call is happening:
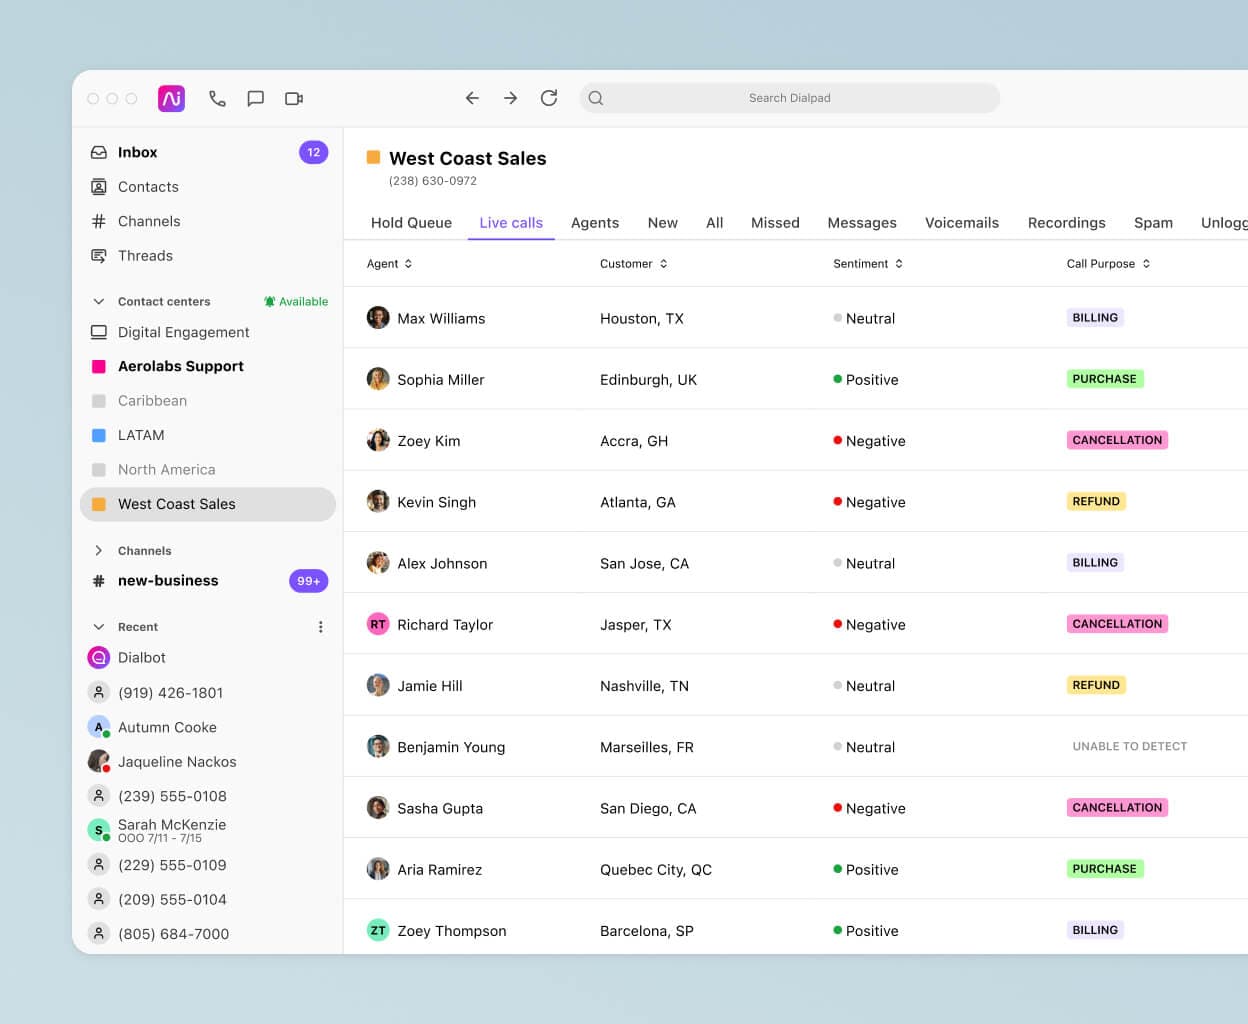
Then they can decide whether they need to jump in and help the agent. That’s a great example of how actionable insights can help you provide a better customer experience and help agents live on calls.
Need contact center reporting?
Instead of paying for a separate contact center reporting solution, why not use a robust contact center platform that comes with built-in analytics and dashboards that tell you everything from missed calls to average speed to answer, and key topics on customer calls?
See how Dialpad Ai Contact Center is designed to do exactly that!
See Dialpad's contact center reporting features
Let our team walk you through how easy it is to monitor your metrics and overall contact center operations in Dialpad. Or, take a self-guided interactive tour of the app on your own first!


