6 key customer satisfaction metrics for contact center managers

Customer Support Manager - Tier 1
Tags
Share
Measuring customer satisfaction is one of the best ways to check whether your contact center is smashing its goals. Happy customers = loyal customers, and loyal customers = more revenue.
If you don’t assess your customer satisfaction metrics regularly, you could jeopardize your CSAT (customer satisfaction score), which influences your customer churn rate, employee motivation, and brand reputation—just to name a few.
The thing is, you’ll see a ton of metrics and KPIs (key performance indicators) being brought up in articles online including everything from first response time and customer health score to agent turnover rate.
Not every contact center team or business needs to measure every single one of these metrics, but you do need to know how to pick out the metrics that really matter to you—and ideally, be able to measure them in real time.
In this post, I won’t throw a long list of 20 or 30 customer satisfaction metrics at you. Instead, I’ll go through a short list of six key metrics in detail, and show you how to measure each one.
Why is customer satisfaction so important?
The biggest reason, of course, is that offering great service helps drive business growth by improving customer loyalty. There’s no shortage of studies online about how consumers are willing to pay more for products and services from brands that provide a better customer experience.
Let’s take a closer look at some of the reasons customer satisfaction shouldn't be ignored and why it’s important to know how you’re doing on customer satisfaction.
It reduces customer churn
It’s not hard for a customer to have a bad experience with a contact center. If you put them on hold for too long, or your agent was rude or distracted, or you transferred that customer back and forth between departments, that customer will remember.
And if a customer doesn’t like the way you do business, they’ll go elsewhere. And in this competitive world, there are plenty of places for them to go.
👉 Dialpad tip:
You can measure customer churn rate (CCR) as the percentage of customers your business loses over a period of time. Just subtract your number of customers at the end of the period from the number at the start, and divide the result by the number at the start of the period.
It can improve loyalty and retention
On the flip side, offering great customer support can go a long way in helping you keep more customers, for longer. It could be something as small as knowing your customer’s name and making sure your agents have easy access to previous interactions so that customers don’t have to keep repeating their problems or issues.
As well as boosting your customer retention, a satisfied customer is also more likely to consider a product/service upsell. Again, there are many studies suggesting that customers are more likely to make repeat purchases (and recommend your business to their friends or colleagues) if you provide excellent customer service.
It promotes positive word of mouth
If a customer has a negative experience with a company, they’ll tell their friends and family about it. They might post a bad review online, or they may even call you out on social media—and that kind of bad publicity is the last thing you want.
On the other side of the coin, according to a study by Qualtrics, customers who rate a company’s customer service as “good” and “excellent” are 38% and 50%, respectively, more likely to recommend that company to a friend or relative.
Look at all the touchpoints on the customer journey and see how you might improve them. Good service can turn customers into loyal brand advocates, and word-of-mouth is an incredibly influential—and inexpensive—form of advertising, which is the next benefit on this list. (Learn more about different customer service techniques.)
It reduces your marketing expenses
Want to save your marketing team some money? How about a classic: word-of-mouth? How much free publicity could you be getting if your happy customers tell their friends how great you are?
If you can keep your customers satisfied, you’ll have more happy customers (aka. loyal customers), and if saving money with free word-of-mouth isn’t enough financial incentive, remember that new customer acquisition costs (and all the marketing it entails) are anywhere from six to seven times higher than the cost of retaining existing customers.
Yet another reason to measure customer satisfaction metrics.
👀 Want to provide a better customer experience?
Grab The Contact Center Playbook, which includes real-life case studies and learnings from five contact center leaders!
6 customer satisfaction metrics to consider tracking
So, we know why customer satisfaction is so crucial. Let’s look at how to measure it effectively using these metrics.
1. CSAT score
How it works
One of the most important customer satisfaction metrics out there, tracking CSAT scores is an essential for most companies because it gives you a general idea of overall satisfaction.
Typically, you’d send out customer satisfaction surveys or play an automated survey on the phone, depending on which channel you’re trying to measure a service experience on. In Dialpad Ai Contact Center, you can easily create a CSAT survey in seconds:
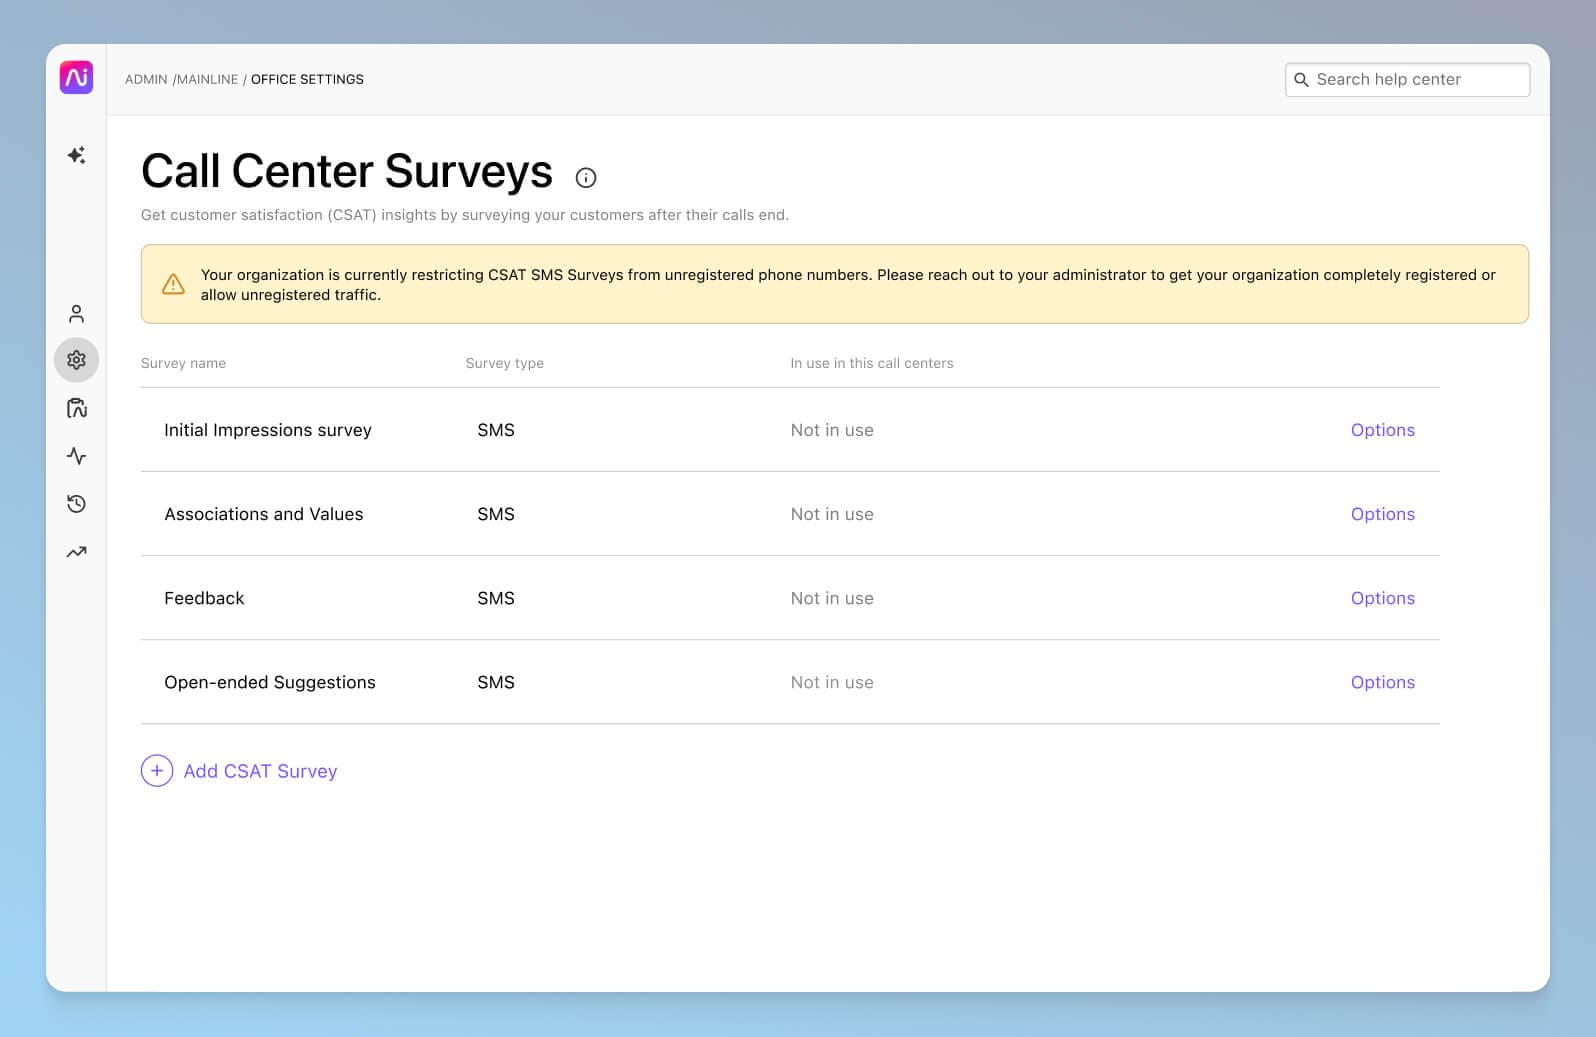
You can even add an open-ended question as a follow-up, asking your caller or customer to elaborate on why they gave you the score they did. Some companies use a numerical scale to measure customer feedback from 1 (very dissatisfied) through 5 (very satisfied). Others might ask customers to choose verbal descriptors or emojis.
Fun fact: In Dialpad’s Contact Center platform, you can track CSAT scores and also search through call transcripts to see how often customers mention things like “price” or “technical problem.” (This could mean a bigger issue that should be passed on to the relevant teams.)
You can track these keywords by setting up Custom Moments, which are triggered when a preset word or phrase comes up in conversation—a bit like a bookmark. Here’s a look at how you’d set one up:

But that's not all that Dialpad Ai can do.
One of the biggest challenges with CSAT scores is that not a lot of people actually fill out those surveys. In fact (depending on the industry and specific business of course), we've found that on average only about 5% of customers actually fill out CSAT surveys. On a related note, usually only the angriest—and happiest—customers actually bother to do this, which means your CSAT answers are likely to be very skewed and not representative of your actual audience on a holistic level.
Dialpad's industry-first Ai CSAT feature is designed to solve exactly that. Not only can our Ai transcribe calls and analyze sentiment in real time, it can also infer CSAT scores for 100% of your customer calls thanks to its hyper-accurate transcription feature. The result? A much more representative sample size for CSAT scores, and a more accurate understanding of how satisfied your customers really are:
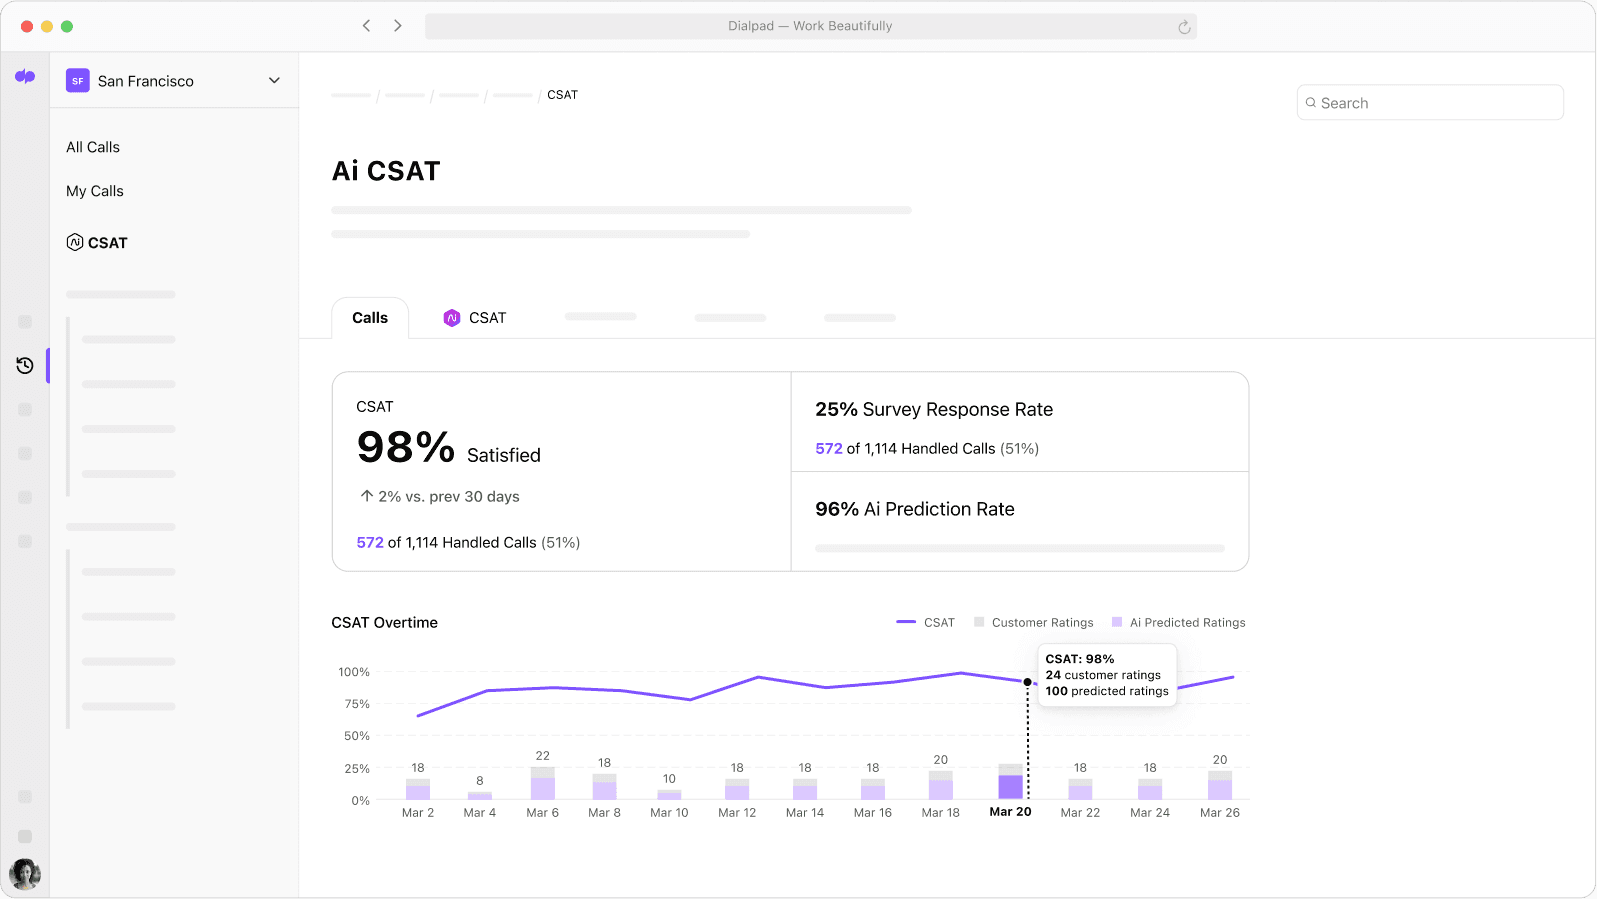
It opens up a whole new world of possibilities for gathering customer intelligence, by gleaning more insights from a source of data you already have: your everyday customer conversations.
The benefits of tracking CSAT
There’s not too much to it—your CSAT score is one of the most basic ways to see how satisfied customers are with your service or products. Almost every company tracks it (or some variation of it).
One thing to keep in mind: like with all the other metrics in this list, you should never look at CSAT in a vacuum. Always look at data in the context of the big picture. A high CSAT score alone might look nice, but what if you have a high CSAT score and also your call duration is super high? Financially and from an agent performance perspective, what story does that tell?
Want to see how Ai CSAT works?
Book a product tour to get a personalized walkthrough!
2. Customer effort score (CES)
How it works
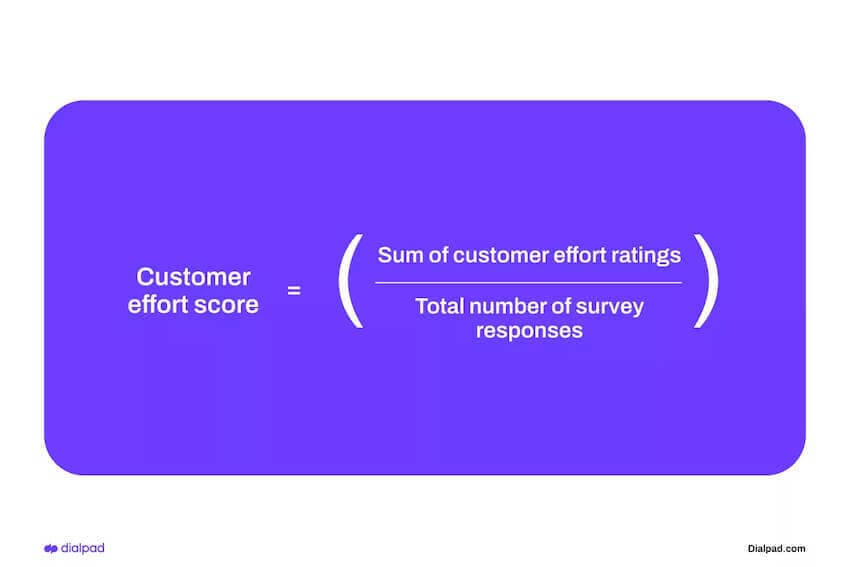
This one is based on how easy or difficult it is for customers to interact with your business. This includes things like getting a question answered, installing an app, or returning something for a refund or exchange. In a contact center, it indicates how much effort they have to expend to get their call answered and their query resolved. Like with CSAT, you can send out a CES survey to find out how you’re doing. Or, use this calculation:
The benefits of tracking CES
Since this affects the overall customer satisfaction level, it’s well worth tracking. After an interaction, you can simply ask your customer to rate the ease of their experience with a survey question, with responses ranging from “very hard” or “strongly agree” to “very easy” or “strongly disagree.”
You can then use these findings to find those friction points and improve the customer experience, making it as easy as possible for customers to get what they want.
Customers who only need to put in low effort are more likely to be satisfied—and loyal—whereas things like long wait times typically require high effort. (Plus they can’t really get on with anything else while they’re waiting on the phone with you.)
You can improve your CES by making sure that your contact center is staffed properly and that your agents are well-trained. Beyond just being attentive and polite, really good contact center agents are particularly skilled at anticipating customers’ needs and requirements. (I always try to hire folks like these!)
3. Net promoter score (NPS)
How it works
Essentially, this metric is used to determine whether your customers will sing your praises or talk trash about you. (Okay, that’s a bit of an oversimplification—your NPS score offers an indication, not a definite certainty, that they’ll do either of those things.)
You’d usually find your NPS through an NPS survey that asks your customers a single question: on a scale of zero to 10, how likely are they to recommend your company to a friend or family member?
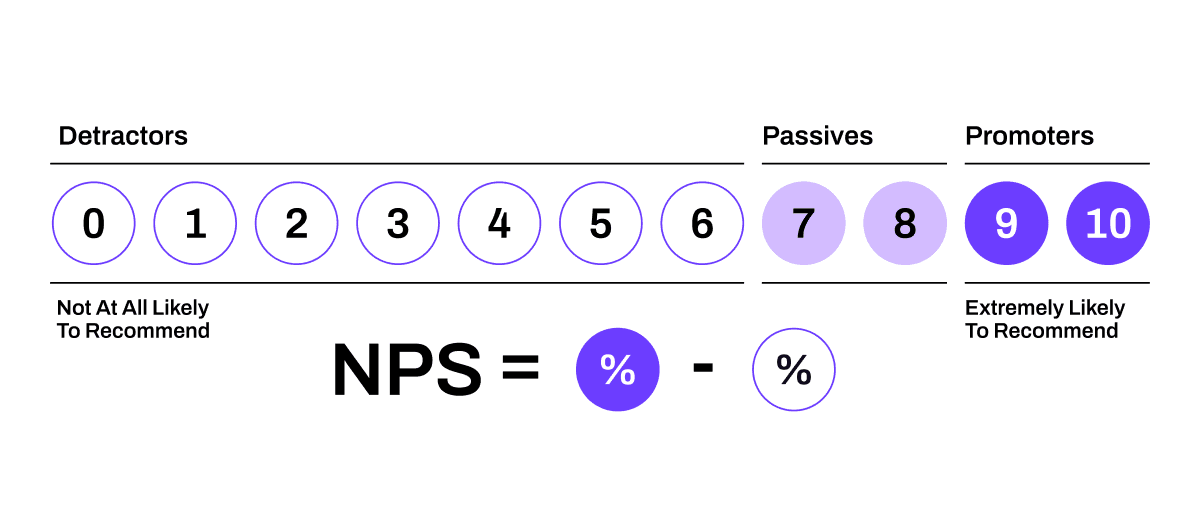
From this, your respondents are divided into Promoters (those who gave you a score of nine or 10), Passives (a score of seven or eight), and Detractors (six or lower). To calculate your NPS score, just subtract the percentage of Detractors from the percentage of Promoters, which should give you a score between -100 and 100.
The higher the net promoter score, the more likely the customer will recommend you. And in general, the higher the number of responses you get, the more confident you can be that it’s an accurate representation of what your customers think of you.
The benefits of tracking NPS
Knowing your NPS score helps you put a number on customer satisfaction and brand loyalty, so that you can come up with ways to improve your score if it’s lower than it should be.
Again, the downside is that such a simple question doesn’t allow for any nuances, such as why they gave that rating, so you might want to get in touch and ask for more details—and yes, look at other metrics in addition to NPS.
4. Average speed to answer (ASA)
How it works
Waiting in call queues is the worst. If a customer is already unhappy about a product or service, having to spend an eternity on hold (while a robotic voice assures them that their call is important) is not going to help things.
👉 Side note:
We actually did a bit of research to understand the impact of wait times on customer satisfaction—see the results here!
Average speed to answer tells you how long your callers waited until your customer support team answers the call, and starts measuring the time after the greetings and menus are finished.
The better staffed and trained your contact center is, the more likely you are to achieve a good average speed to answer.
The benefits of tracking average speed of answer
It’s pretty easy to track ASA. Just take the total waiting time for calls answered in a given period and divide it by the total number of answered calls.
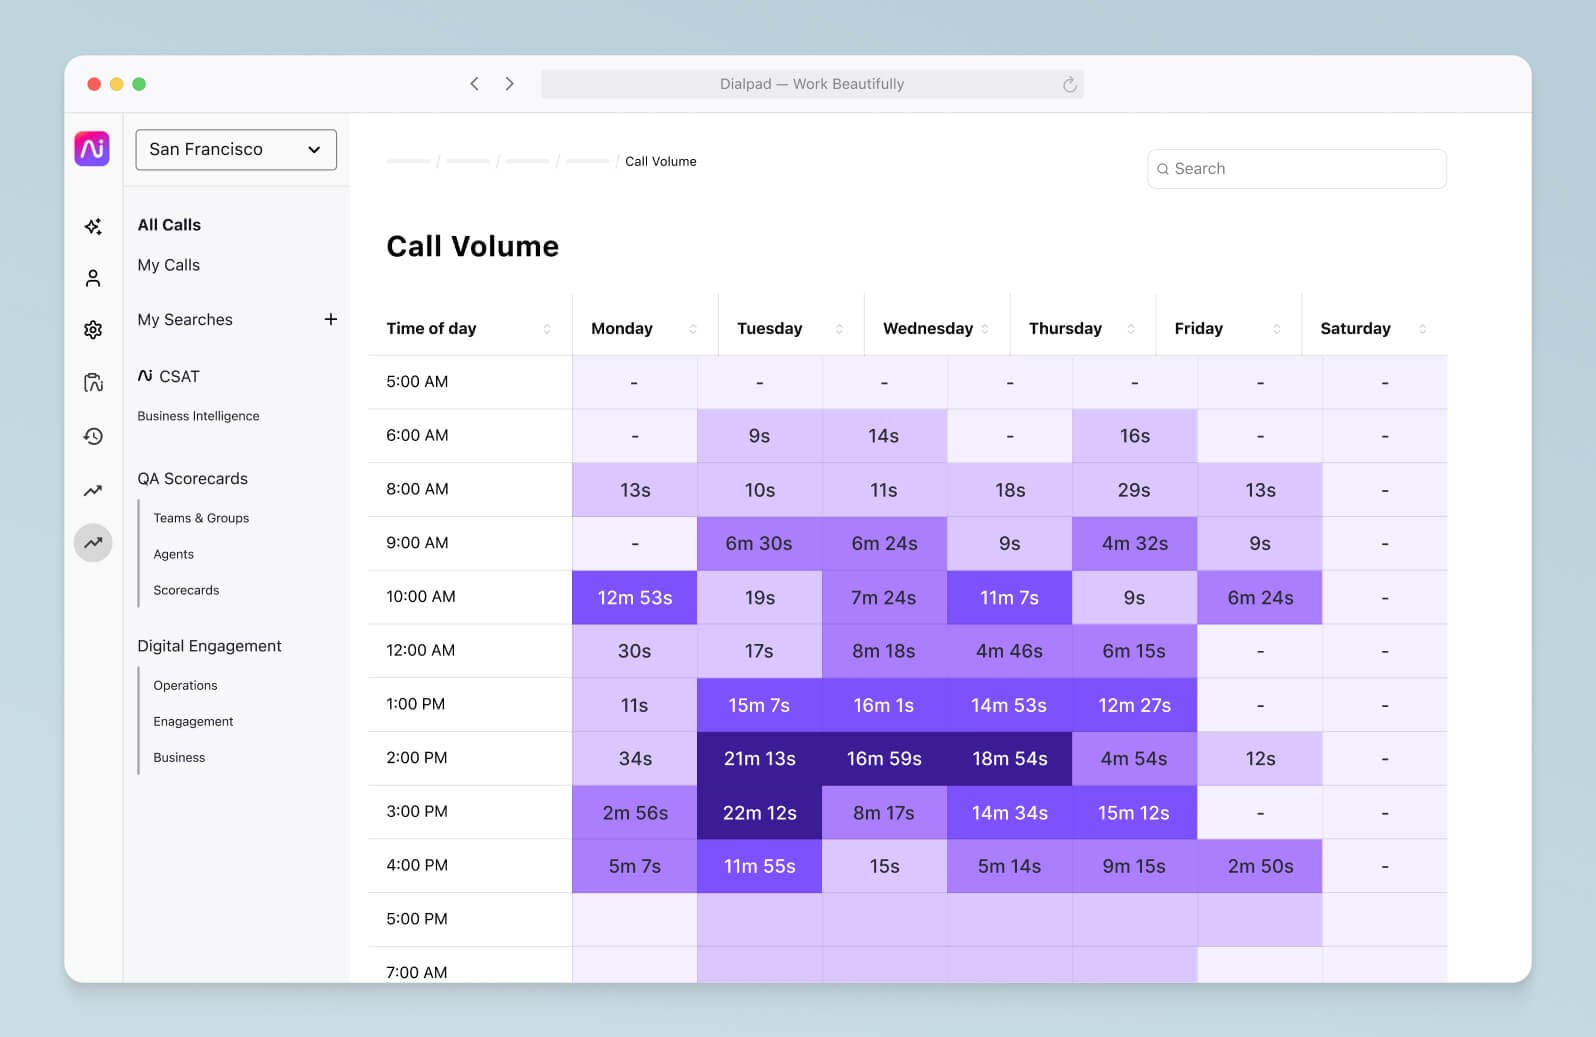
One great thing about Dialpad is that I don’t have to calculate anything! It shows how our average speed to answer is trending over a period of time in the form of a heat map. department. You can filter these for a specific day or week and, when you filter for a month, Dialpad returns a daily average across all days of the week.
We use this data to staff the team more effectively, because it can show us whether we might be short-staffed or overstaffed and if there are patterns at certain times of day, week, or month:
And it doesn’t have to be just about phones—if you’re taking queries on multiple channels, measure those response times too. This way, you can divide agents between phones, email, and chat more efficiently and help them focus on one thing at a time rather than being spread too thin.
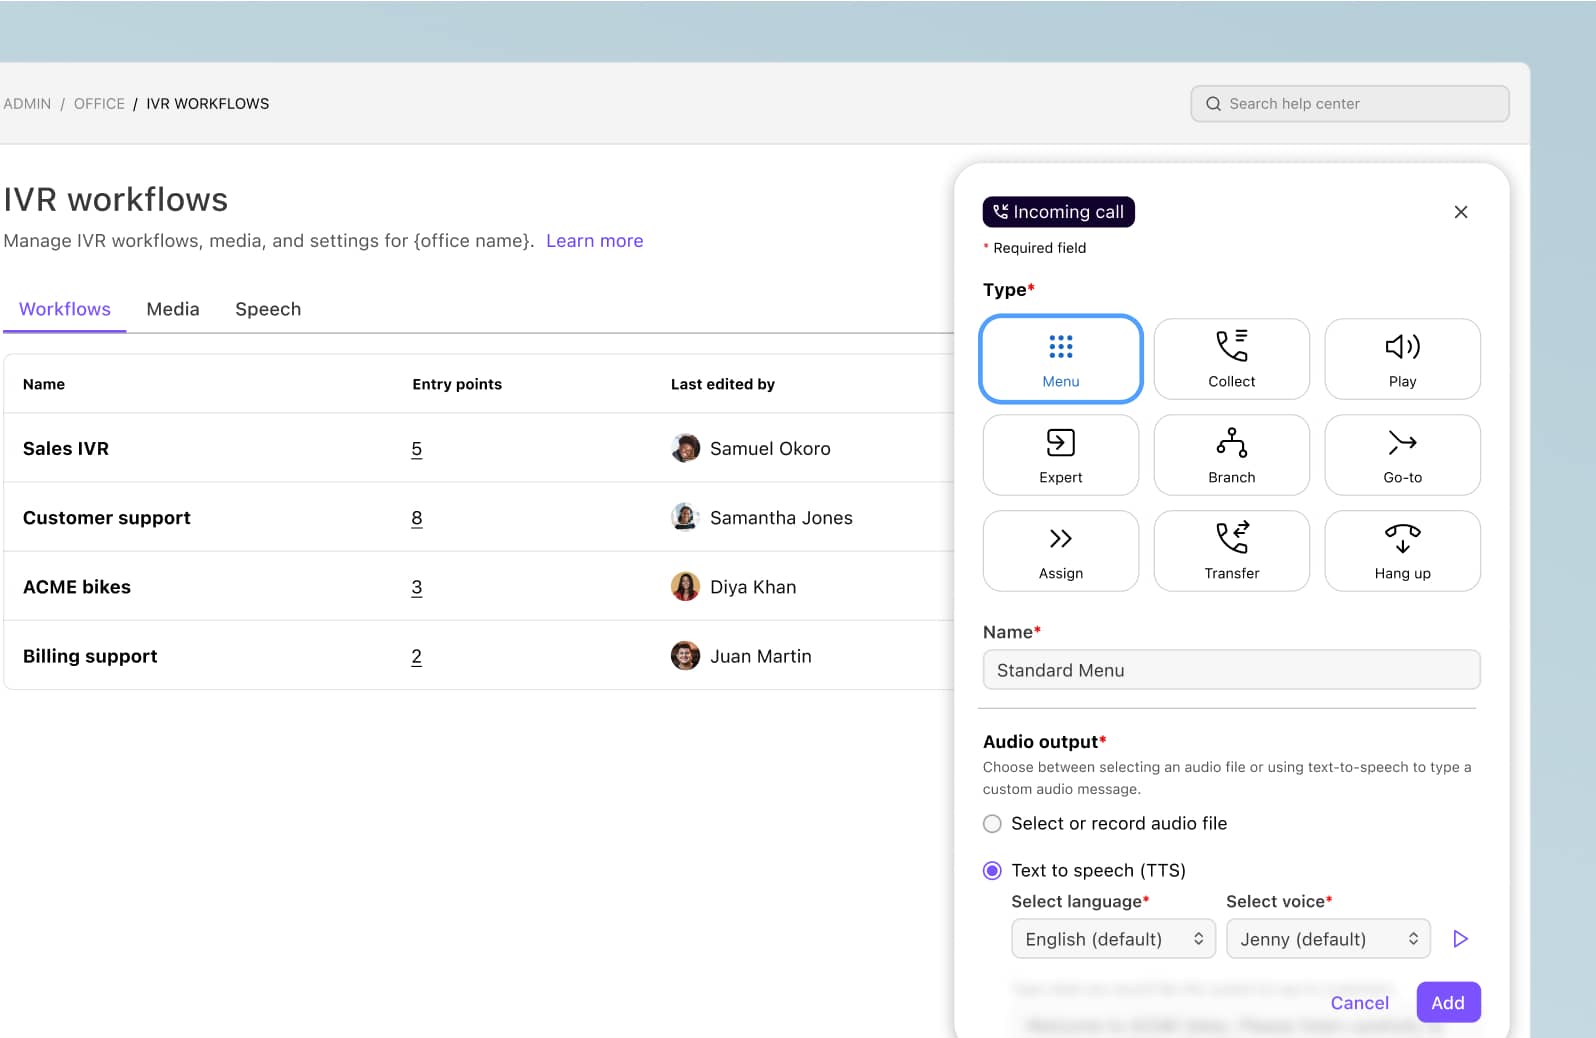
You can also improve your average speed to answer by having a well-planned IVR or ACD (automatic call distributor) system that lets callers route themselves to the right department or people or get answers to basic questions (like business hours and return policies) without needing to talk to a live agent.
Dialpad’s analytics are again very helpful here—we can see which IVR options are used, and which ones aren’t, which helps us streamline the menu options down to only the most useful ones:
5. Abandon rate
How it works
This refers to the number of abandoned calls recorded by a contact center in a given amount of time. Hint: you want this number to be as low as possible. If more calls are abandoned than answered, you’ve got a serious problem.
Abandoned calls are usually those that end before the customer even reaches an agent. They may hang up while in the queue or while they’re listening to menu options. Some people also abandon calls if they’re sent to voicemail instead of being connected to an agent.
Again, if you don’t connect the customer in a relatively short time, they’ll get fed up with waiting. If they hang up, you’ve missed out on a potentially crucial interaction, whether it’s the chance to resolve an issue or the opportunity for a sale.
The benefits of tracking abandon rate
Logging abandoned calls is vital, as it’s a major indicator of how well your contact center is performing. Once you have the figures, you can start finding out why customers abandon calls. Are they doing it deliberately (and if so, why), or are they getting sent to voicemail or having their call ended automatically?
You can choose not to include extremely short calls in the metrics—if someone hangs up after one or two rings (maybe they realized they’d dialed the wrong number, or they got interrupted by the kids), there’s not much you could have done to rescue the call.
Monitoring call abandonment helps you see if your call center is understaffed or if certain agents need extra help or training. (In Dialpad, we have a leaderboard that shows which agents have the most abandoned calls among other stats.)
From here, what can we do to make them hold on a little longer? Use better hold music? Play pre-recorded messages or check-ins informing them of their position in the queue or how long (realistically) the wait time is, or offer a callback option?
👉 CX tip:
With Dialpad, it’s easy to route calls to live operators, auto attendants, voicemail greetings, specific departments, or even individual team members to make sure they’re all transferred efficiently from the get-go. This should help decrease your abandon rate.
One more note: Service level agreements
Service level agreements (SLAs) are usually made between a service provider and customers to define expectations for service quality and what would happen if these criteria weren’t met.
For example, if you’re a software company, you might guarantee 99.99% uptime and a response from your support team within 12 hours. (Just FYI, Dialpad promises 100% uptime SLA for Enterprise customers.)
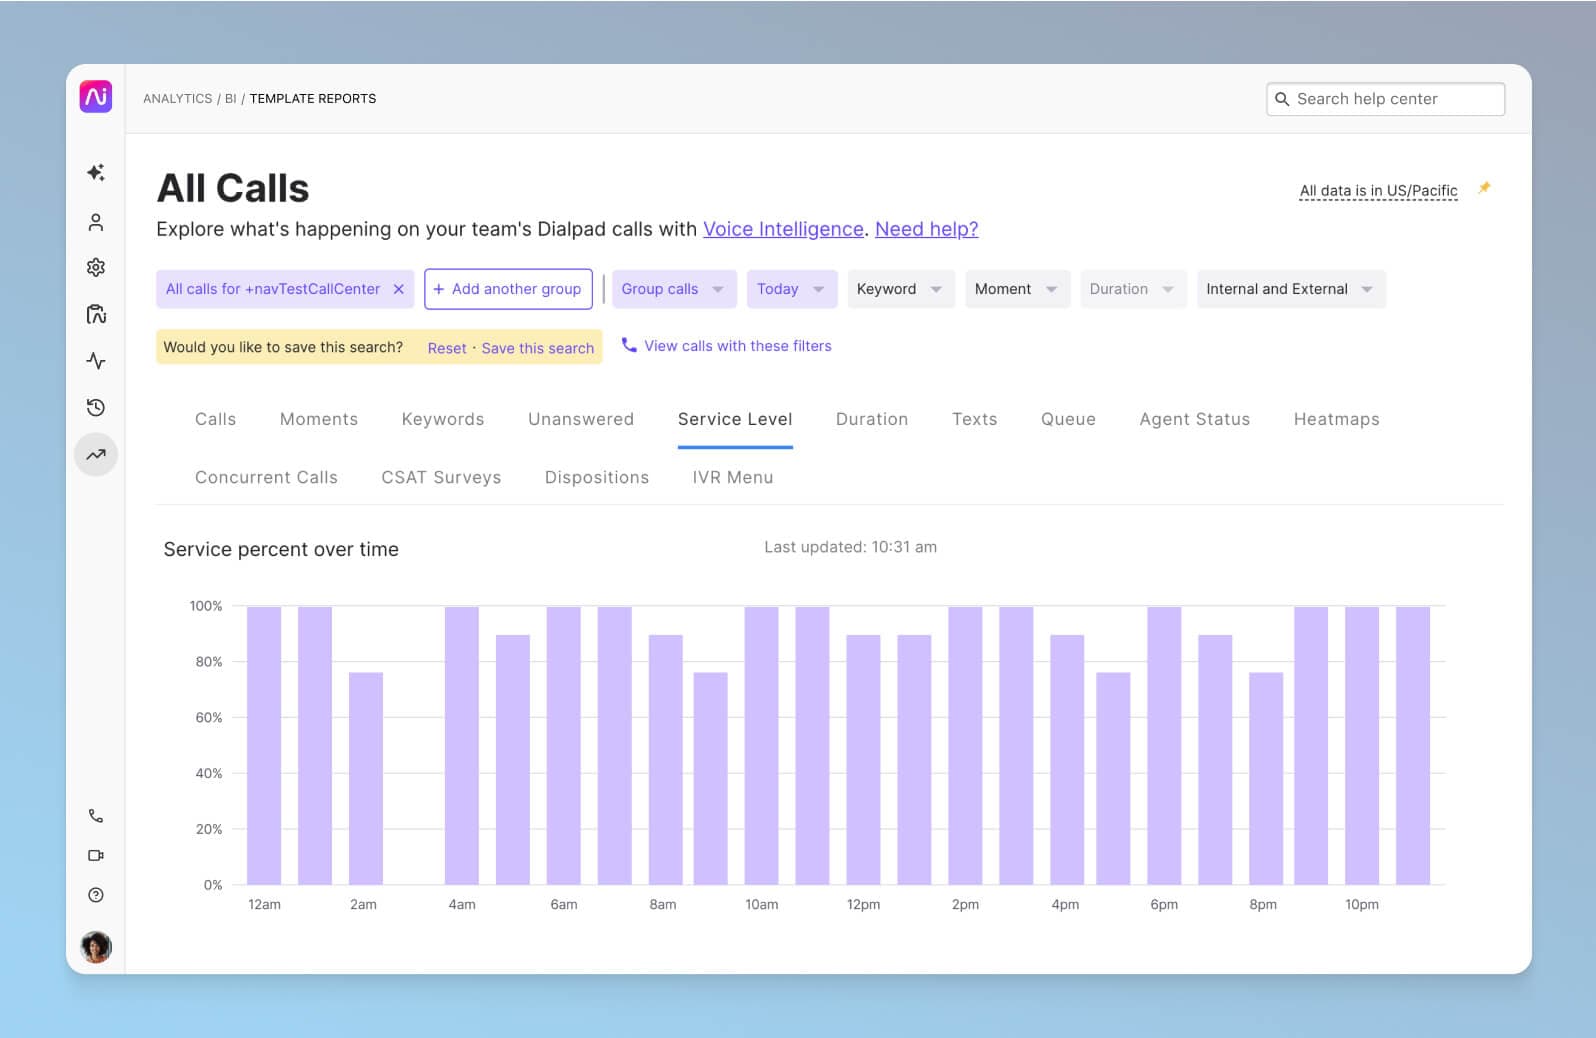
SLAs can be difficult to measure and report on, but contact center software can help you here. A contact center supervisor in Dialpad can set up a service level alert that notifies them if, for instance, inbound calls aren’t getting answered within a certain length of time:
The benefits of tracking SLAs
This is a mission-critical one. If you don’t live up to the terms of your SLA, your customer is going to be seriously unhappy—and you could even be liable for a fine.
One of the key benefits of meeting your SLAs is that you avoid breach penalties, which can significantly reduce the revenue you get from your products or services. And in the event of a failure, SLA reports allow you to evaluate what happened and what could have been done differently.
If you have prospects that are large organizations, they’ll probably want to know what your SLA compliance or attainment rate is before even considering giving you their business, so this is an especially important consideration for B2B organizations that sell to large businesses.
Improve your customer satisfaction metrics with Dialpad!
To recap, customer satisfaction is crucial to your company’s success—but you don’t have to measure every metric in existence.
Use the metrics described in this post as a starting point to figure out where your contact center (whether it's a small business call center or enterprise contact center) is going wrong—and right!—and find ways to improve the overall experience for your customers.
Want to be able to track your customer satisfaction metrics more easily?
Book a demo of Dialpad's AI-powered customer engagement platform to see how it can empower your supervisors and agents to measure how they’re performing. Or, take a self-guided interactive tour of the app first!


