15 essential call center metrics and KPIs to track

Director, Tier 1 Support and Development
Tags
Share
If there's one universal truth when it comes to running a call center, it's this: the list of KPIs (key performance indicators) you could measure is almost endless. So how do you identify the metrics that truly matter—the ones that will help improve efficiency, enhance customer experience, and boost overall performance?
The key is to start with your goals. Every call center has different priorities. At Dialpad, for example, our goal is to provide world-class support at all times. Once you define your objectives, the right metrics become clear—any KPI that doesn’t contribute to your core goals is less relevant.
In this blog post, I’ll walk through 15 essential call center KPIs. Not all of these will be useful to you! (Every contact center is different, right?) This is just a good initial list for you to think through as you're considering which KPIs are best for your contact center.
There are countless possible metrics you can track, so it’s helpful to group them into buckets like:
contact center efficiency - metrics that measure the operational effectiveness of your contact center, e.g., average handle time (AHT) and first response time
customer experience - indicators that reflect customer satisfaction and ease of interaction, e.g., Net Promoter Score (NPS) and Customer Effort Score (CES)
agent performance - metrics that assess individual agent productivity and engagement, e.g., occupancy rate and after-call work time
What call center metrics should you track?
The right call center metrics to track depend on your specific business goals. Before selecting KPIs, managers should first identify their top priorities—whether that’s improving customer satisfaction, optimizing operational efficiency, or reducing costs.
Once the goals are clear, managers should align KPIs with actionable insights that drive improvement. Rather than tracking every available metric, focus on the ones that provide meaningful data and directly impact business outcomes. For example, if cost reduction is a key objective, metrics like cost per call and agent turnover rate can highlight areas for optimization.
15 essential call center metrics & why it's worth tracking them
Like I mentioned above, there are plenty of different metrics that can be useful to a call center. These are just 15 commonly important ones that make up the difference between a good call center and an excellent one.
👉 Dialpad tip:
Bear in mind, I'm coming at this from a customer support angle. Contact centers can be used for many other functions as well (like sales and recruitment), so those KPIs will look different from the ones I've listed here. Certain KPIs might be universally applicable, but that's why it's so important to figure out your specific goals first—otherwise you might be tracking the wrong KPIs for your business.
1. Average handle time (AHT)
This KPI tells you how much time your agents are spending on each call, on average. The shorter your call center's AHT is, the more quickly your customers' queries are resolved.
The goal isn't necessarily to make sure that your call center's average speed of answer is under a minute, or anything as drastic as that.
👉 Dialpad tip:
A customer with a more complex problem needs more time to receive proper care, after all, and is just as important as one with a simple problem. Don't encourage agents to cut calls short just to keep AHT low, since this can easily lead to a drop in quality of care.
How it's calculated: (Talk Time + Hold Time + After-Call Work) ÷ Total Calls Handled
2. First response time (FRT)
First response time (FRT) is the time between a customer’s inquiry and the agent’s first response.
This applies to various channels, including phone, email, and chat. For example, if a customer sends an email at 10:00 AM and receives a reply at 10:30 AM, the FRT is 30 minutes. While you do want to shorten your FRT as much as possible—faster responses improve customer satisfaction and reduce frustration—accuracy is still important. You don’t want agents providing fast but wrong answers to customers.
How it's calculated: Time of First Response – Time of Customer Inquiry
3. Average abandonment rate
This KPI refers to the percentage of callers who hang up before reaching an agent. This includes times when customers hang up while they're in the queue, or while they're listening to the menu options. High abandonment rates suggest long wait times or inadequate staffing, so one thing I try to do as I'm coaching my team is keep an eye on if certain agents have many more abandoned calls than others. In Dialpad, there's a leaderboard that shows this cleanly:

How it's calculated: (Abandoned Calls ÷ Total Incoming Calls) × 100
4. Average speed of answer (ASA)
This metric tells you the time it takes for an agent to pick up after a call enters the queue. According to Call Centre Helper, the average for ASA globally is 28 seconds. ASA should be kept as short as possible to keep your customers happy.
Dialpad has a feature that I absolutely love that helps with ASA. They're called Real-Time Assist (RTA) cards, and especially for newer agents, they're super helpful.
If I notice that certain tricky calls about pricing, for example, are coming in, I can create an RTA card with notes on our pricing, and have these automatically pop up whenever a customer says “price” or “pricing” on a call:
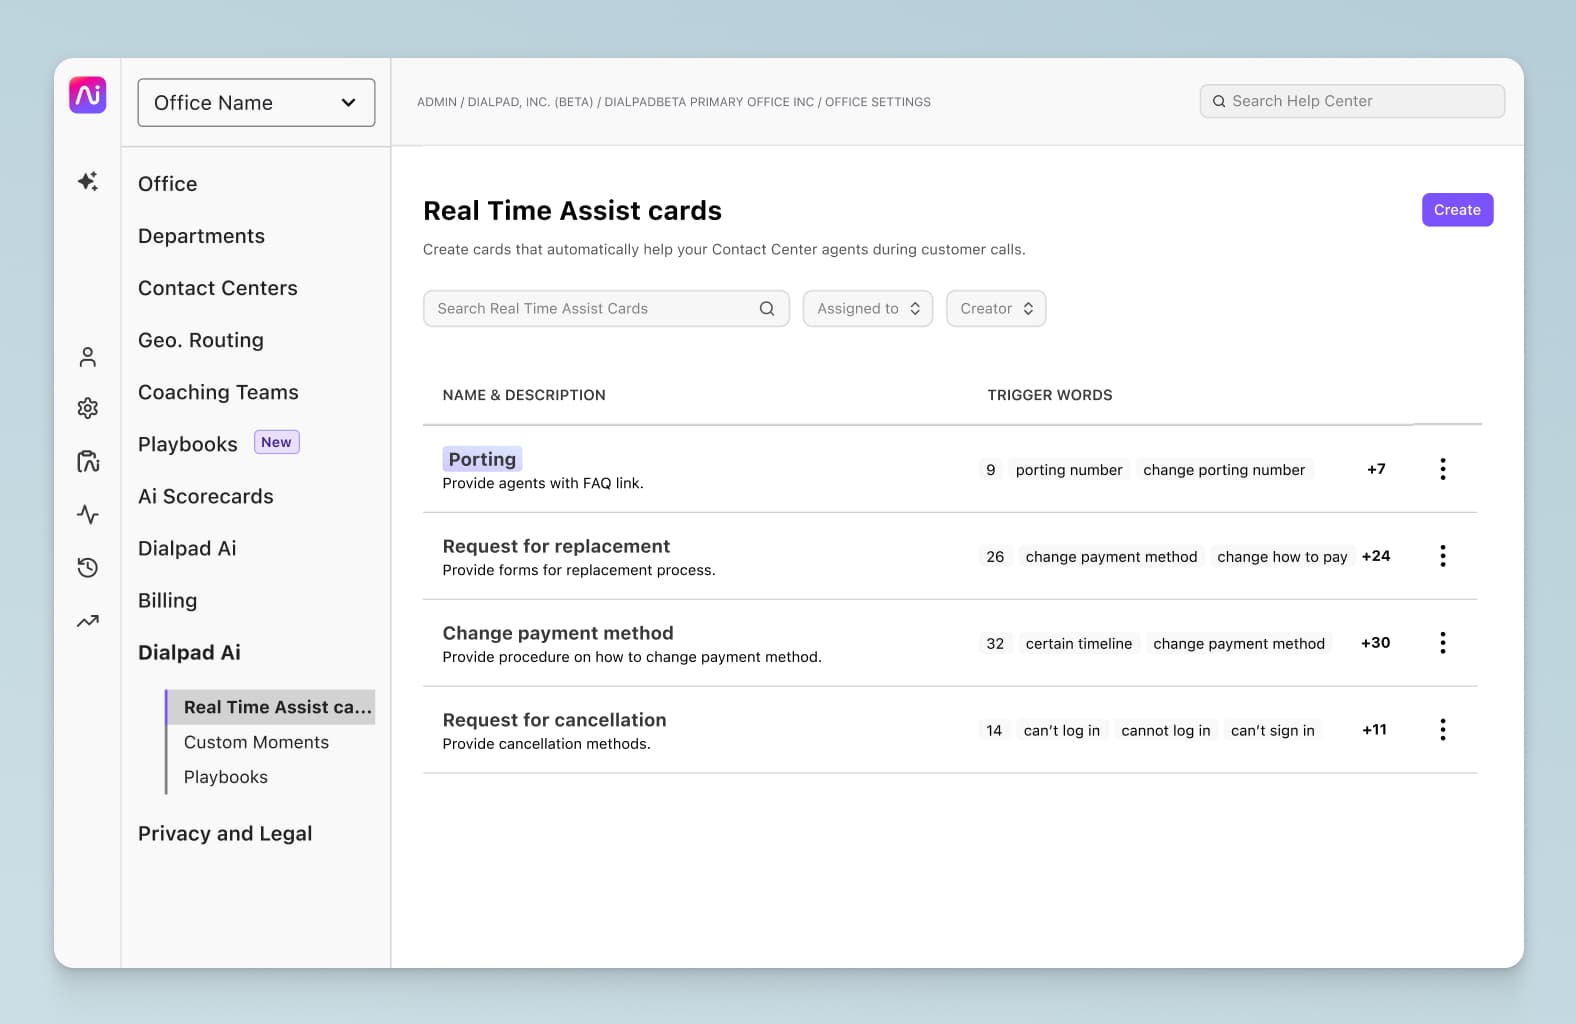
You can set whatever trigger words you want for RTAs, and customize the card content however you like. It's been a big help for our contact center and allowed me to continuously train and teach agents while cutting down on their ASA.
5. Customer satisfaction (CSAT)
Here's one you've probably heard of. CSAT measures customer satisfaction with the service received, typically through post-interaction surveys. Customers are typically asked to rate their experience, and then given the option to leave feedback.
Since the CSAT feedback forms are sent out immediately after a call ends, you can see how your agents are performing in real-time based on their CSAT scores.
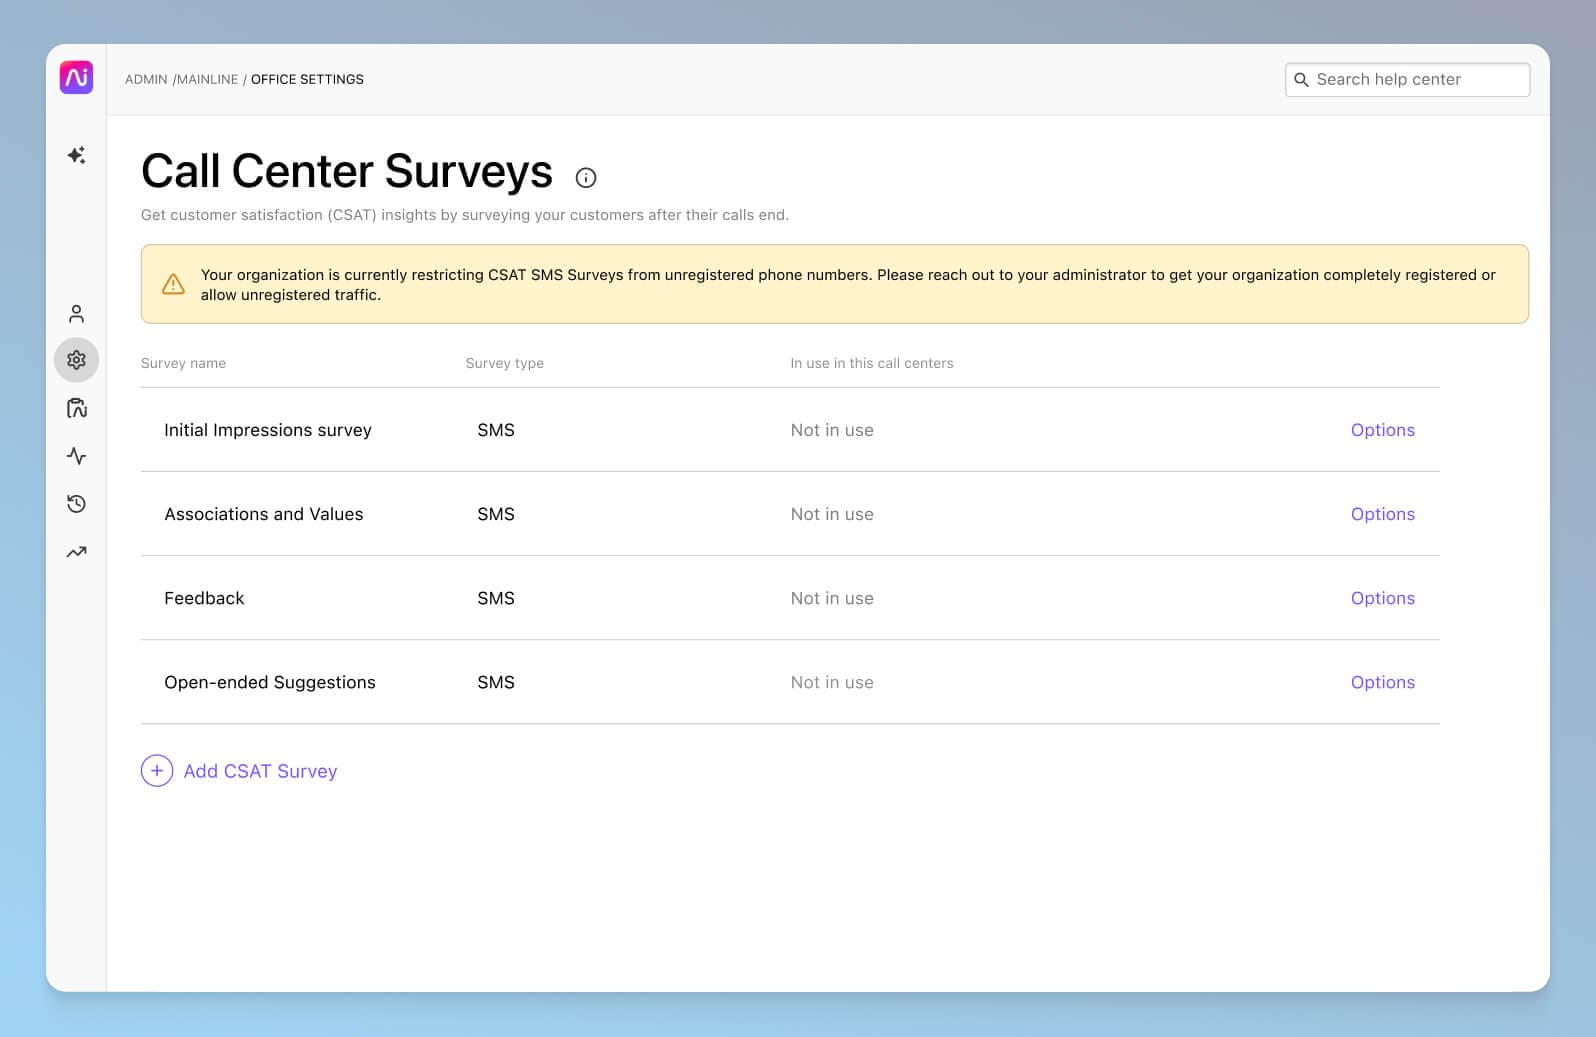
In Dialpad, it's easy to create a CSAT survey right from your Settings page:
Of course, there's one big issue with CSAT surveys: Most customers don't fill them out.
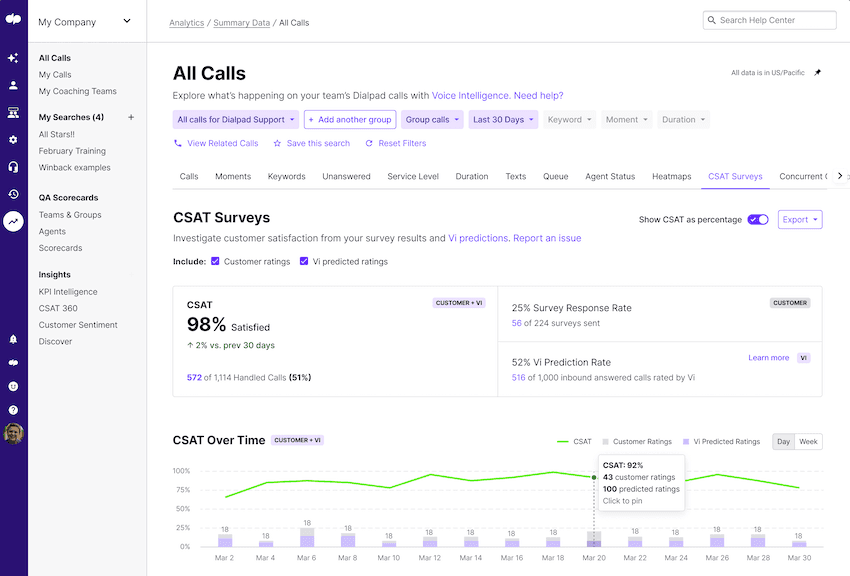
In fact (depending on the industry and specific business), we've found that on average only about 5% of customers actually fill out CSAT surveys. On top of that, usually only the angriest—and happiest—customers actually bother to respond to these surveys, which means your CSAT answers are likely to be very skewed and not representative of how your customers feel overall.
Dialpad's industry-first Ai CSAT feature is designed to solve exactly that. Not only can our Ai transcribe calls and analyze sentiment in real time, it can also infer CSAT scores for up to 100% of your customer calls thanks to its hyper-accurate transcription feature. The result? A much more representative sample size for CSAT scores, and a more accurate understanding of how satisfied your customers really are:
According to The American Customer Satisfaction Index (ACSI), overall customer satisfaction in the US is about 77 on a scale of 1 to 100.
How it's calculated: (Total Positive Responses ÷ Total Survey Responses) × 100
6. Average time in queue or average hold time
This metric tracks the average amount of time callers spend waiting in the queue before being connected to an agent. Long wait times can indicate staffing shortages or inefficiencies. Benchmark: Typically, you’ll see the oft-cited industry standard of 80/20, which means 80% of calls should be answered by agents within 20 seconds.
During peak hours, your agents will likely experience a massive increase in their total number of calls, meaning that more agents and quicker turnaround times are required to keep customers' average time in queue as short as possible.
How it’s calculated: Total Wait Time of All Callers / Total Calls Answered
7. Average after-call work time (AWT)
After call work time (AWT) measures how long agents spend on post-call tasks, such as documentation and note-taking. While efficiency is key, rushing can lead to errors, and benchmarks can vary depending on the type of business, contact center, and tasks agents need to perform.
In Dialpad, you can set a “post-call wrap-up time” that functions in a similar way—even though not every call requires AWT, it's also nice to give your agents a bit of a break between calls:
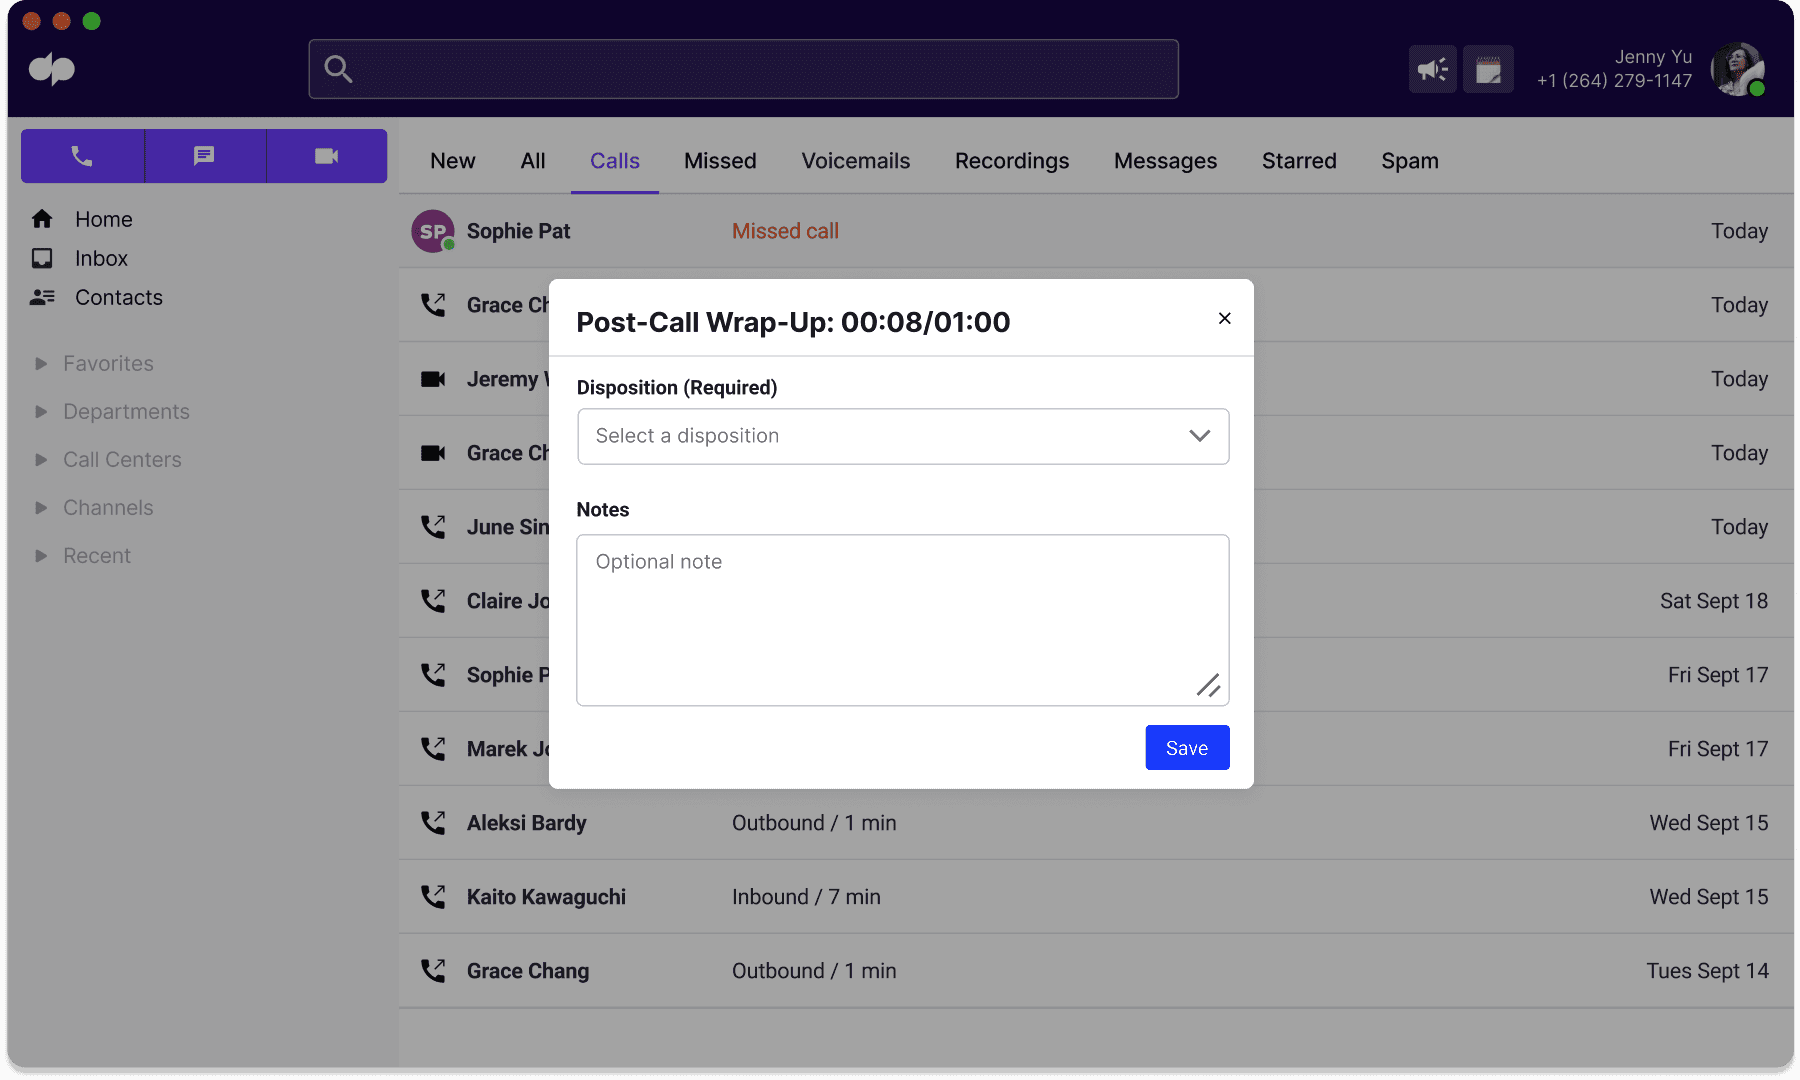
How it’s calculated: Total After-Call Work Time / Total Calls Handled
8. First call resolution (FCR)
FCR is the percentage of customer inquiries resolved on the first call. As you might guess, higher rates mean fewer callbacks and greater overall efficiency. According to the SQM Group’s research and benchmarking,a good FCR rate typically falls between 70% and 79%.
How it’s calculated: (Total Cases Resolved on First Contact / Total Cases) × 100
9. Cost per call
Companies have to pay a specific price per call. This price is determined by factors like the cost of the call center software they're using, staffing costs, and the length of each call. In other words, the cost per call metric helps track the financial efficiency of a call center. Lower costs are good, but shouldn’t compromise service quality.
In most cases, longer calls will cost more. At the same time, a longer call has the potential to save companies money on the whole, since the customer placing the call will be less likely to need to contact them twice. It's a balancing act.
How it’s calculated: Total Operational Costs / Total Calls Handled
10. Revenue per successful call
This KPI isn't quite in my team's purview, but is crucial for sales-focused call centers because it measures how much revenue each successful call generates, and also helps managers optimize sales strategies and resource allocation..
How it’s calculated: Total Revenue from Calls / Total Successful Calls
11. Occupancy rate
A call center's occupancy rate is the percentage of time its agents spend on call-related activities, including taking calls and AWT.
Typically, your maximum occupancy sits comfortably in the 75 to 85% range, then your agents are working optimally. Occupancy shouldn’t be at 100% because at 100% occupancy, agents are taking absolutely no time between calls, meaning they're working literally like machines.
Over time, this results in burnout and high turnover—and will end up costing you more than any small efficiency gains it might provide.
How it’s calculated: (Total Time Spent on Calls and Related Work / Total Time Available) × 100
12. Agent turnover rate
Agent turnover rate measures how frequently agents leave the call center (as in quit their jobs) within a given period.
Happy agents don't want to leave. And a call center full of agents who are motivated to work hard and stay with your company is one that's going to bring the best results.
How it’s calculated: (Number of Agents Who Left / Average Number of Agents) × 100
13. Net promoter score (NPS)
NPS is a popular metric that measures customer loyalty and likelihood to recommend a business to others.
NPS is measured on a scale of -100 to 100. Customers fill out an NPS survey asking them how likely they are to recommend a company to a friend or family member. The higher the score is, the more likely the customer is to recommend the company.
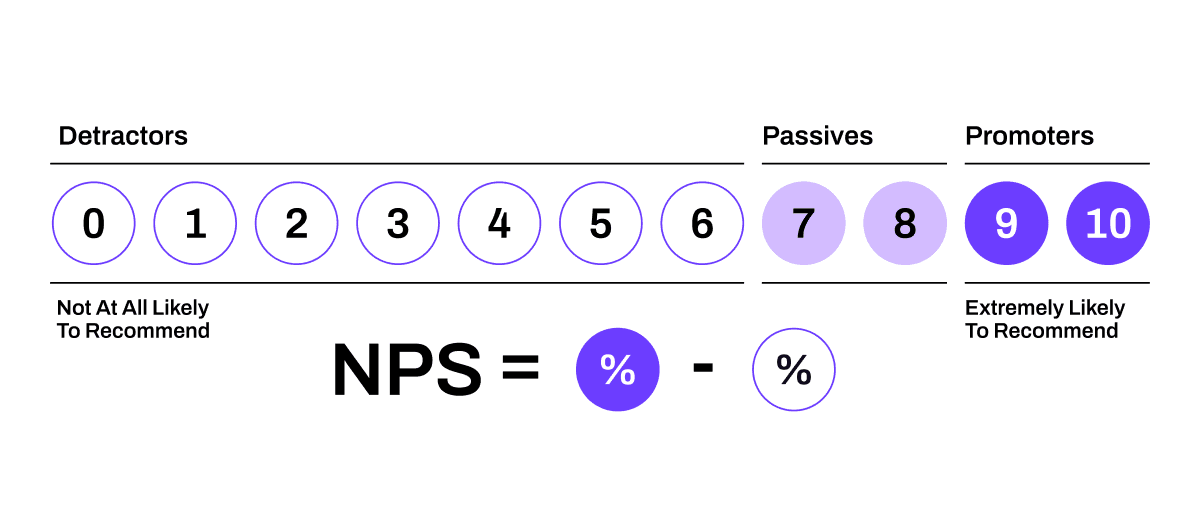
According to SurveyMonkey’s benchmark data for over 150,000 organizations, the average NPS is +32.
How it’s calculated: % of Promoters - % of Detractors (from survey responses)
14. Customer effort score (CES)
CES is a metric that's designed to measure how much effort a customer has to put in to get their query resolved. The goal here is to make it as easy as possible for customers to get what they want.
Many factors impact a call center's CES. For example, long queue times and a high transfer rate both increase the amount of effort customers need to exert (from increased wait times or having to repeatedly explain their issues to different agents).
How it’s calculated: Average Score from Customer Survey Responses
15. Percentage of calls blocked
This KPI measures how many calls fail to reach an agent due to system limitations or spam filtering.
Call centers aren't immune to spam calls, unfortunately. Contact center solutions like Dialpad Support will have built-in spam blocking and filtering to keep these calls from wasting your agents’ time.
How it’s calculated: (Total Blocked Calls / Total Incoming Calls) × 100
Not all call center metrics and KPIs will capture your customer experience goals
That's our rundown of the most useful call center KPIs. However, to know how best to make use of your data, you need to understand how metrics relate to your CX goals.
The best way to figure out which metrics are helping you capture your goals is to consider the outcomes that each one is measuring—and then work backwards to check the relevance of each of these outcomes to those goals.
Otherwise, you might just be left with a dashboard full of charts and numbers, but no useful way to gain insights or actionable next steps from that data.
Even if it is a well designed and cleanly laid out dashboard, like in Dialpad Support:
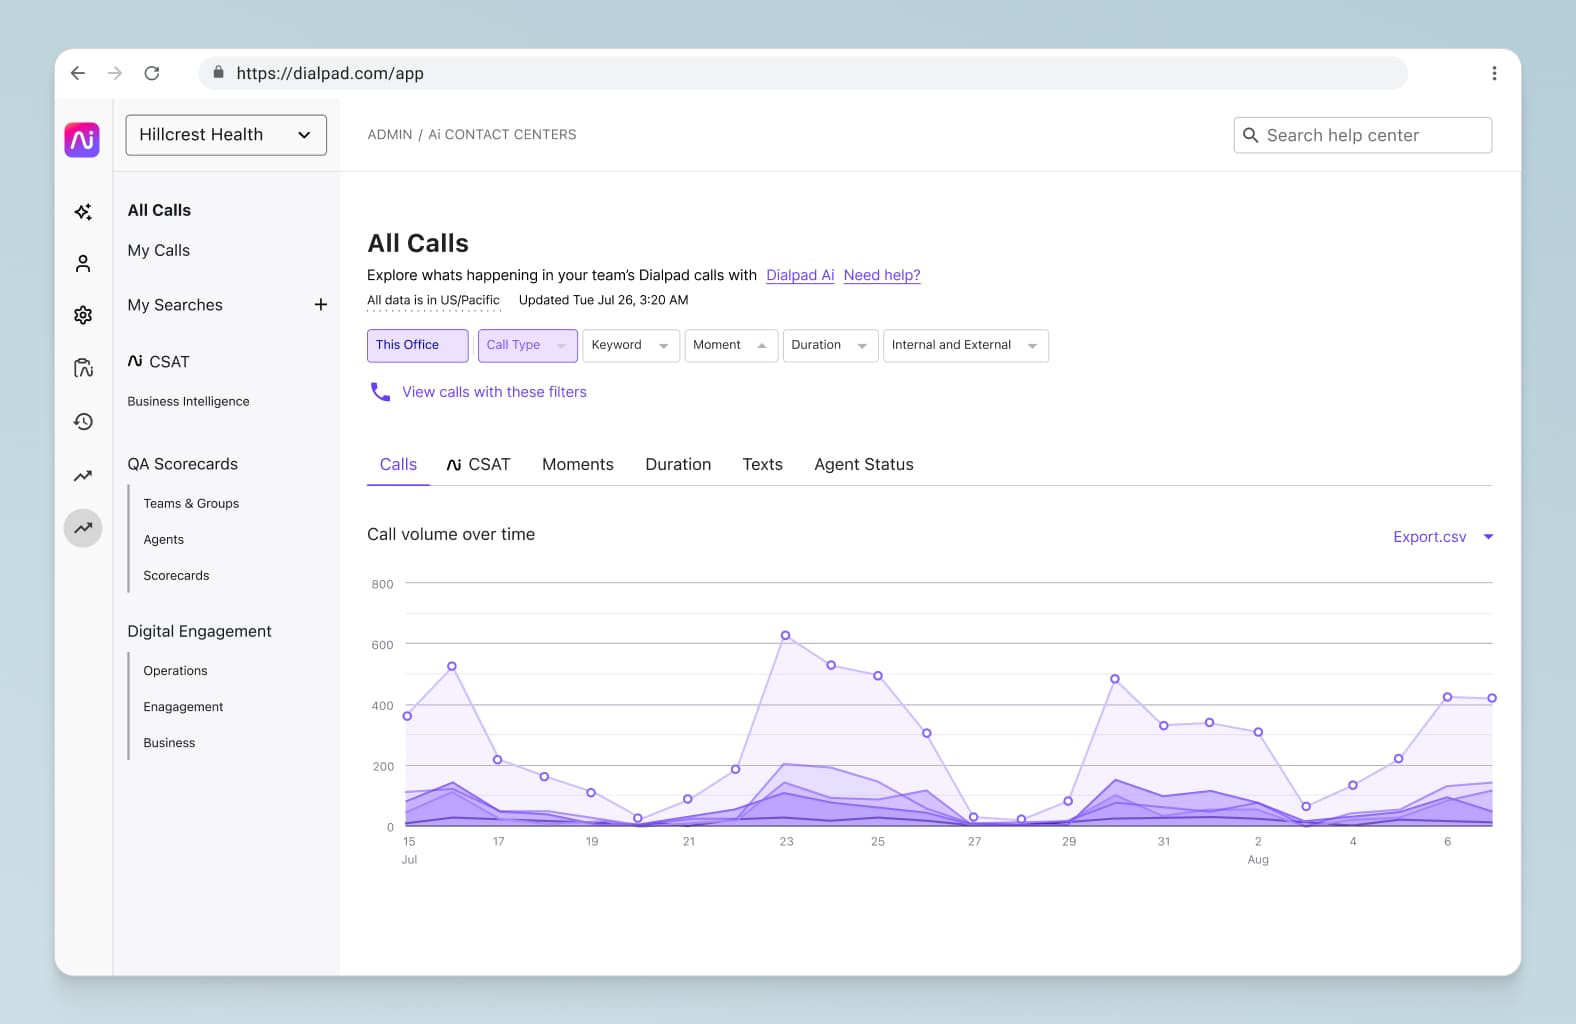
To really illustrate the importance of this, here's an example.
Say you're running your own Avengers team. You want to make sure that your team is protecting the Earth from villains and other attacks, so in order to measure the effectiveness of your heroes, you come up with some metrics.
A helpful one might be “reduced injuries among civilians,” because that would show you that your Avengers are keeping the population safe.
On the other hand, an unhelpful metric could be the number of people tweeting with the hashtag #Avengers, since this only tells you that your team is being talked about, and not whether people are praising or criticizing them.
The same general idea applies when you're searching for metrics to help you achieve your customer experience goals.
At Dialpad, our goal is for every call center agent to be able to help customers as efficiently and effectively as possible. That's why we need to use call center KPIs and metrics that will ultimately help us increase customer satisfaction and/or call center agent productivity.
In other words, every metric has to measure whether we're enhancing the customer experience, or whether our overall agent performance is improving.
As well as choosing the right KPIs to help us achieve this goal, it's also worth taking a look at how to make sure that your agents are working towards improving their performance under those metrics.
✨ Want to improve your contact center's performance?
Grab the Contact Center Playbook, which breaks down everything you need to know, from setup to improving customer satisfaction—with examples from real contact center teams across different industries.
Aligning your agents with your call center metrics
A crucial part of working as a call center agent is knowing and understanding your call center’s KPIs and metrics. That way, it’s easier to align yourself with both those metrics—and the goals of the company you’re taking calls for.
But how exactly does that look, up close?
The first thing to know is that aligning team members with goals and KPIs is a key responsibility for all call center managers. They should understand their call center metrics well first. This way, it's easier to train your agents to be aligned with those metrics, and it also reduces behaviors like call avoidance.
This includes knowing exactly which aspects of your call center need improvement, and how to help your team members work towards making sure that the next month’s metrics will show better and better results.
All of that can be difficult to do as just one manager looking after many team members with different levels of skill and experience. I should know—I run five contact center teams.
(And I can’t imagine doing it without good software that makes call center management easier.)
Maximize your operational efficiency with the right call center metrics
The KPIs I listed above are a great start in making sure your call center is running as smoothly as possible. If you're looking for a way to measure things like how effective your agent utilization is, or whether your IVR system is serving customers the way it should, this is a good place to begin.
Always remember: The key to using KPIs to your advantage is to make sure your metrics are focused on specific, measurable factors. Instead of just broadly stating you want to know whether your customers are happy with your service, for example, you might say instead that you're going to start sending out CSAT surveys.
Choose the KPIs that work best for you, and happy measuring!
Set your contact center up for success and hit your KPIs!
See how Dialpad Support can help make your agents' and supervisors' lives easier—while empowering them to hit their targets. Book a demo or take a self-guided interactive tour of the app on your own first!


