What to look for in a call center dashboard

Team Lead, Support QA and Development
Tags
Share
If you run a customer support, sales, or other contact center team, you need a call center dashboard. Not only does it show you important metrics like call volumes and response times, it‘s also essential for reporting on agent performance and customer experience (CX).
In fact, your contact center is probably one of the most important sources of business intelligence and insights—and all of that’s from data that you’re collecting at pretty much zero cost... Every day.
So, what should you look for in a contact center dashboard? What nuances should you be aware of when you’re looking for software?
Here’s what I look for when I manage our customer support team.
What is a call center dashboard?
A contact center dashboard is essentially a screen or interface that shows you your key performance indicators (KPIs). Typically, these dashboards provide visual representations of those metrics, whether that’s in the form of a line graph, bar chart, heat map, and so on. This is critical for helping customer support leaders and other contact center managers monitor performance.
If your contact center team is still using Excel sheets or other spreadsheets to do dashboard reporting, it might be time to look at a contact center platform with built-in KPI dashboards.
8 key metrics that a contact center dashboard should show
Every software‘s contact center or call center metrics dashboard looks different, but there are a few performance metrics that all of them should track in order to monitor and improve contact center performance.
👉 Fun fact:
Learn about a major problem with using first call resolution as a core metric.
1. Average time to answer
This one‘s pretty self-explanatory. Your average time to answer is a metric that tells you how quickly you‘re responding to customers (it’s basically the average wait time), whether that‘s on the phone or via live chat messages.
(This does not normally include any time spent with virtual assistants or IVR menus.)
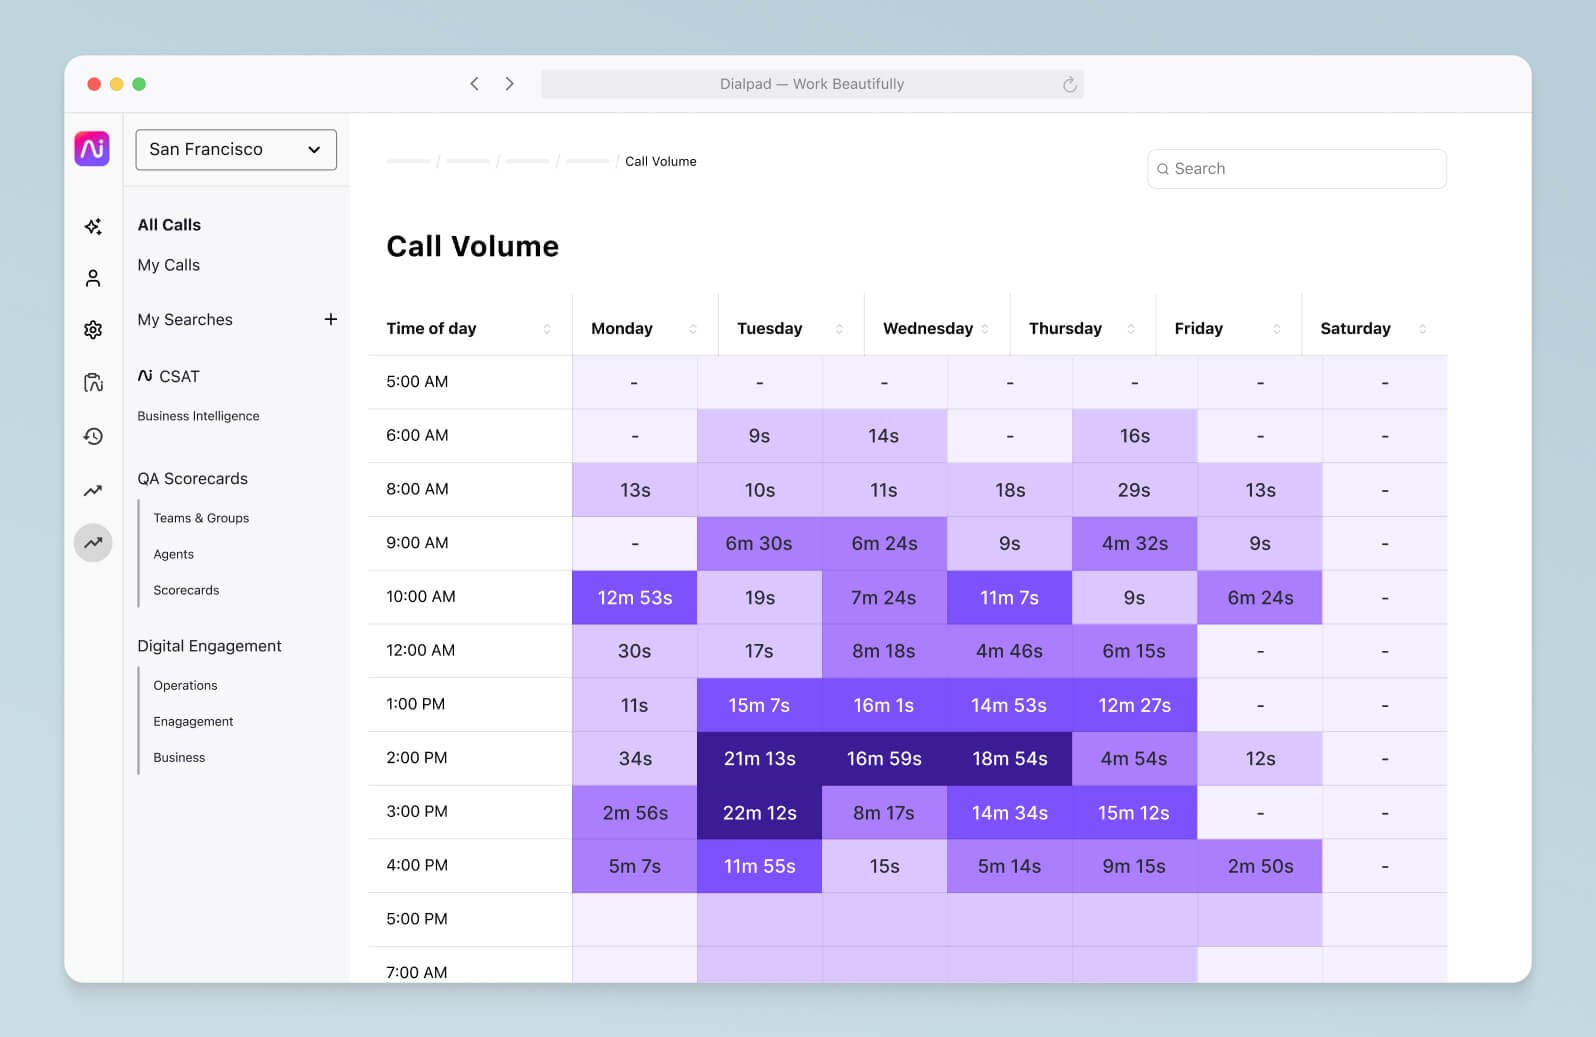
In other words, this is the average time a caller spends in the queue. In Dialpad, this metric is called Average Speed to Answer (ASA), and in the analytics view, there’s a heat map that show you how your contact center is performing—no calculations needed:
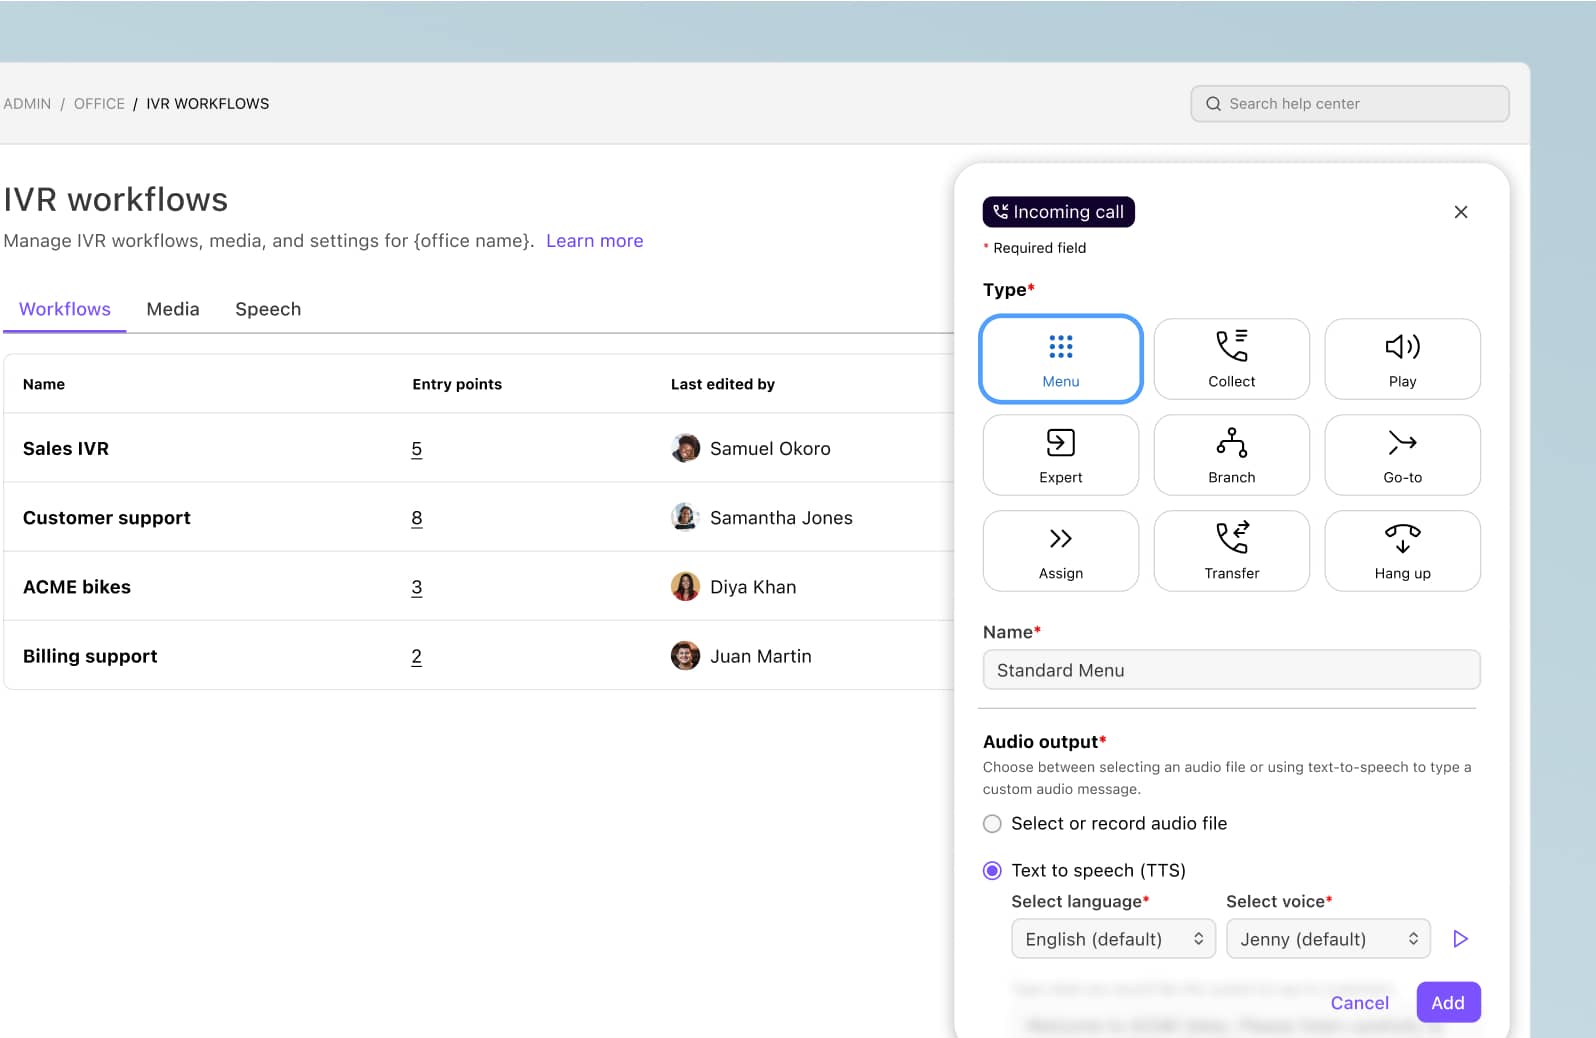
Speaking of IVR, Dialpad also has a built-in dashboard that shows how frequently each IVR menu options are used by callers, which helps us continuously refine that experience and only feature IVR options that our customers and prospects are actually looking for:
2. Call volume
Call volume is a pretty popular metric for contact center leaders because it gives you important insight into how you should adjust staffing in order to maximize call center performance.
Again, like with ASA, Dialpad Ai Contact Center’s analytics view has built-in heat maps that show us call volumes. No need to contact IT or a customer support team or wait hours or days for them to pull this data for you.
3. Missed calls
Missed calls measure the number of missed contact attempts from a customer or prospect. It’s one of the most basic metrics to track in terms of contact center operations, because it’s an easy red flag to spot.
Sudden spike in the number of missed calls? That’s probably negatively impacting your customer experience.
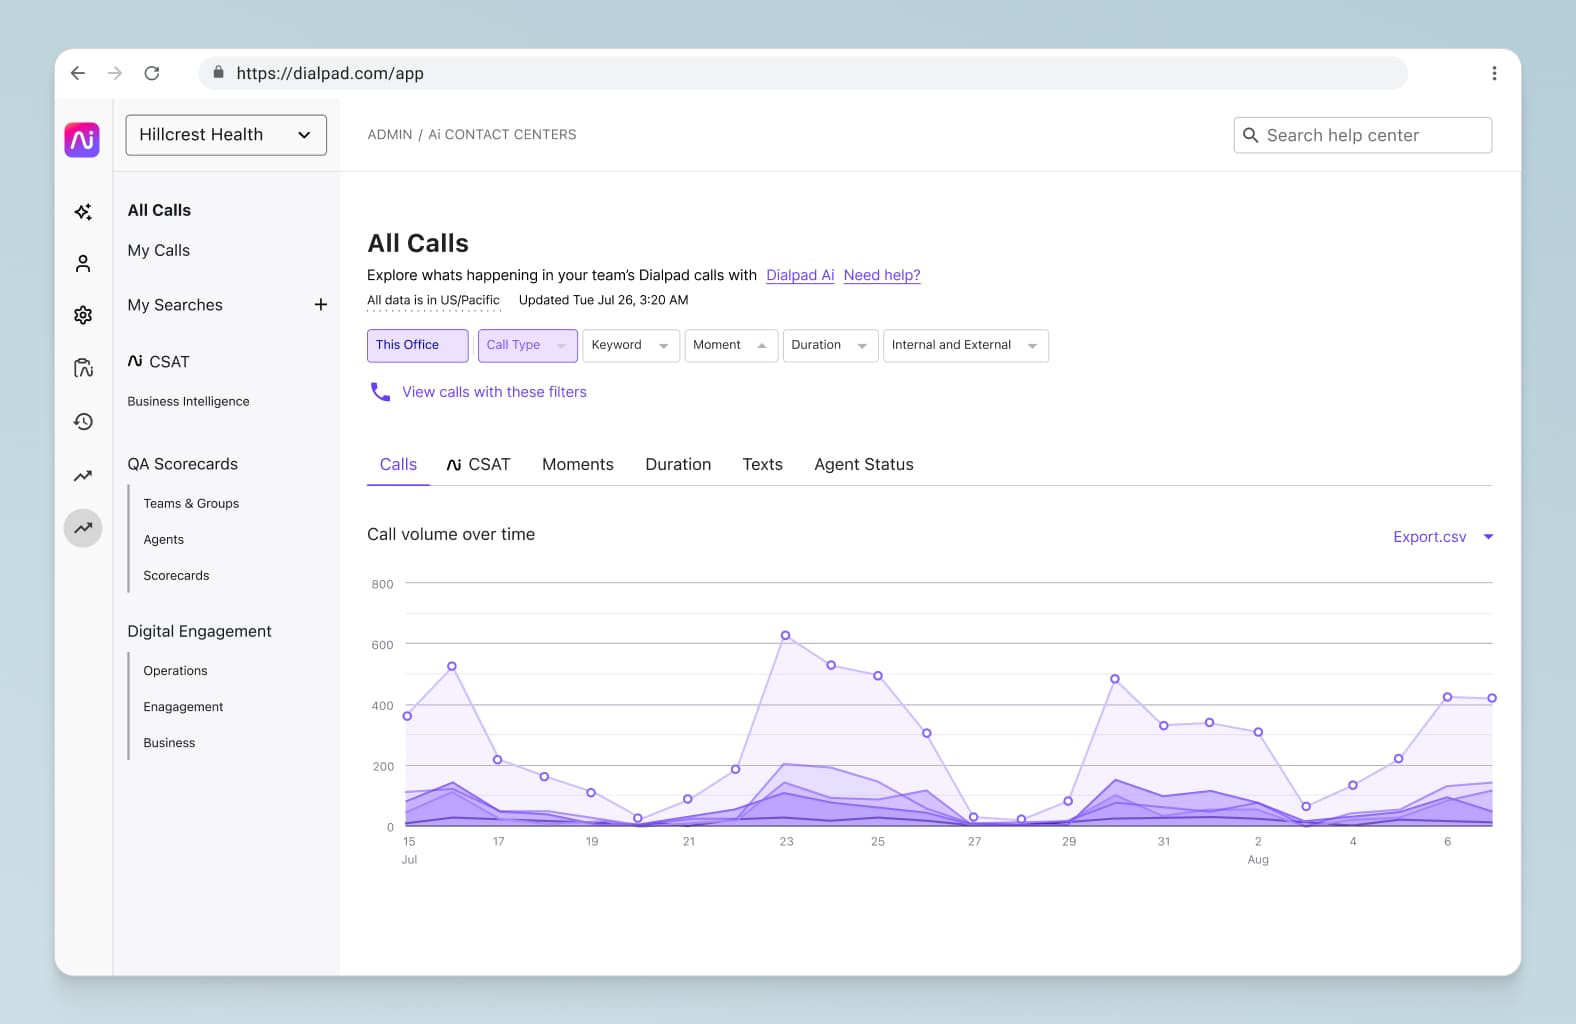
In Dialpad Ai Contact Center, the analytics dashboard shows your missed calls (in addition to abandoned calls and other metrics we’ll talk about below), and is a good call center dashboard example in terms of how clean the design is:
4. Abandoned calls
Another metric that should play a role in your call center management strategy is abandonment rate. Unlike missed calls, abandoned calls are those where the customer hung up before ever being connected to an agent.
Tracking your abandonment rate over time will indicate, for instance, if your on-hold times are too long and leading to people hanging up before talking to someone.
It‘s almost impossible to completely eliminate call abandonment 100%, but it‘s still a call center KPI that you should track and benchmark against.
5. Average handle time
The average handle time (AHT) metric refers to the total length of time from when an agent answers a call to when the issue is fully resolved, including any wrap-up time spent after hanging up. The metric can be a crucial KPI for measuring individual agent performance, and also your entire operation.
Of course, like almost all of the other metrics in this list, looking at this particular piece of call center data alone doesn‘t give you any context at all. The complexity of a customer issue will affect the handling time of a call, for instance.
Dialpad Ai Contact Center has a very cool feature called Real-Time Assist (RTA) cards that helps us shorten agent handle times and improve the overall customer experience. How it works: We can create RTA cards for any number of tricky topics or questions. Say we get lots of questions about how to port a phone number. We can create an RTA card with notes on how Dialpad ports phone numbers for our customers, and set that card to trigger automatically on agents’ screens when “port” or “porting” is spoken on a call:
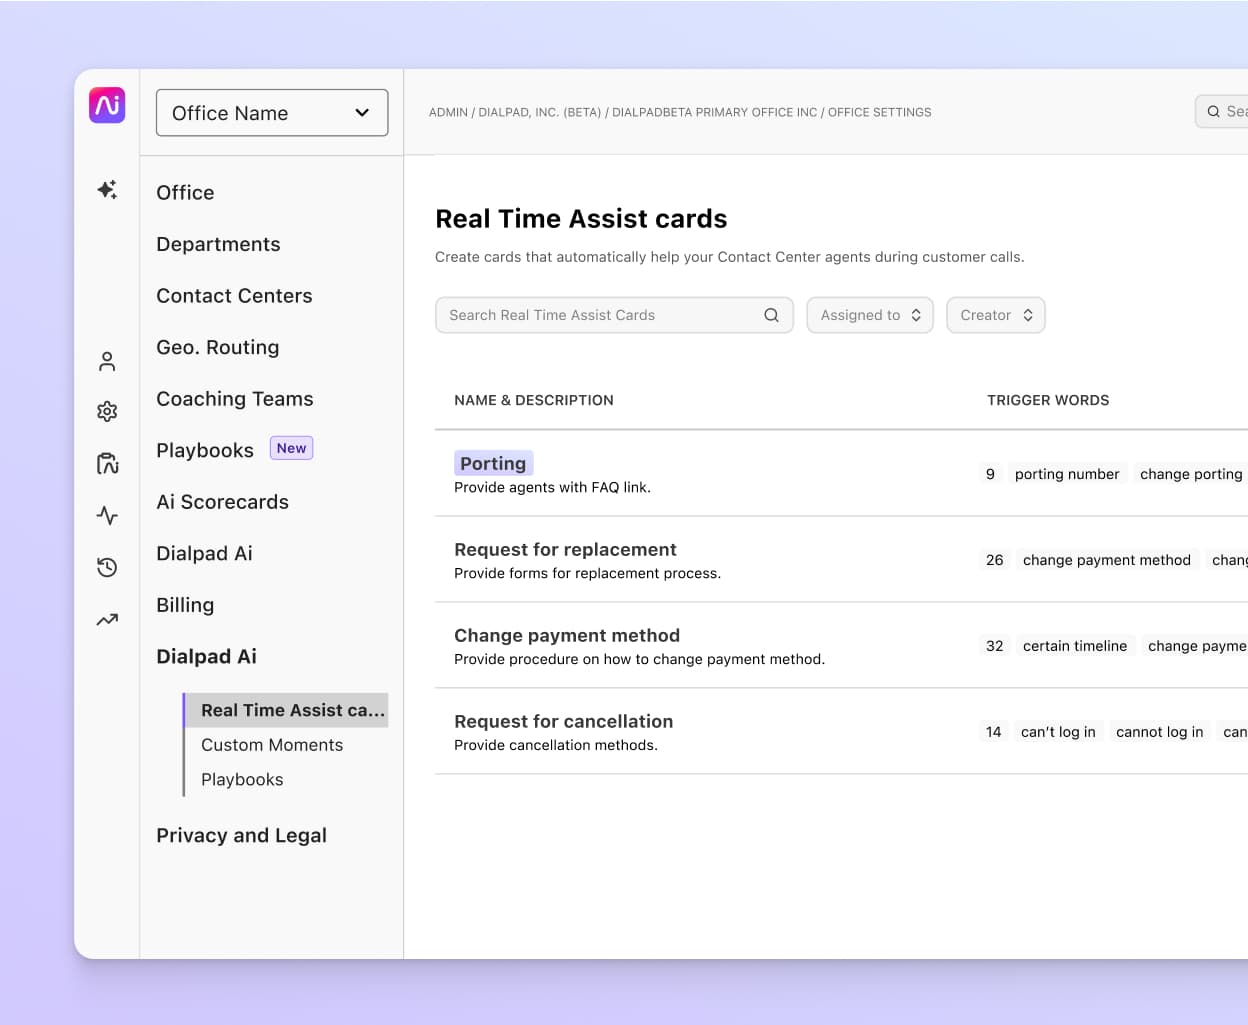
This way, managers like myself don’t have to personally coach every call, but agents can still get the information they need to solve problems quickly and effectively for our customers. It’s like coaching using pre-built templates, on a massive scale.
👉 Dialpad tip:
Don’t look at metrics in a vacuum. It can be misleading without more context—I’d recommend always looking at a constellation of metrics to get the full story.
6. Keyword or topic occurrences
Here’s one that you might not know about. This isn’t a traditional contact center metric, and it applies to both outbound and inbound calls and conversations.
With Dialpad Ai Contact Center, we can track how frequently different topics or issues come up. To do this, we create “Custom Moments“ to track these different topics:
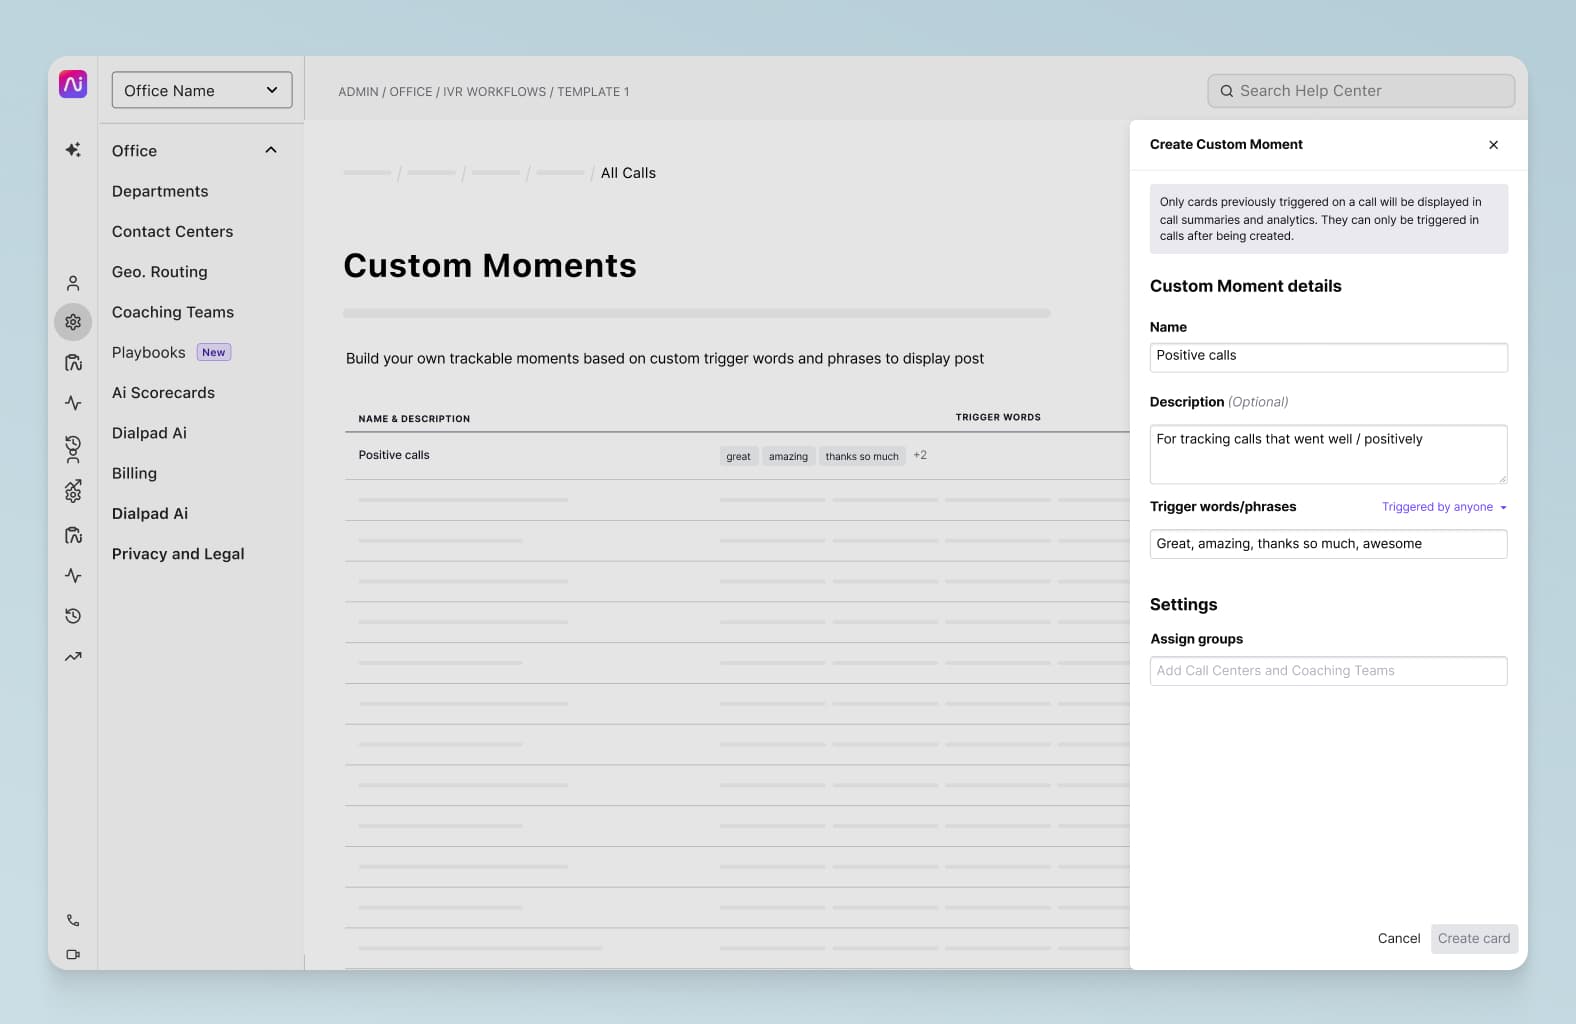
For example, we can create a Custom Moment to track how often we get support requests about Feature X or Y.
If you’re running an outbound sales team, you can use Custom Moments to track how often a competitor’s name or a certain service that you offer comes up!
These insights can be very helpful for call center optimization, because they can tell you where to prioritize training for your agents, what materials you might need to create, and so on. We use this information to know what RTA cards to create.
7. Service levels
Call center KPIs like AHT and call abandonment rate are great for monitoring performance and spotting trends, and another piece of this is your service level agreement or SLA. This essentially is your contact center‘s promise of service—it sets out clearly whether you‘re meeting your end of the deal or not.
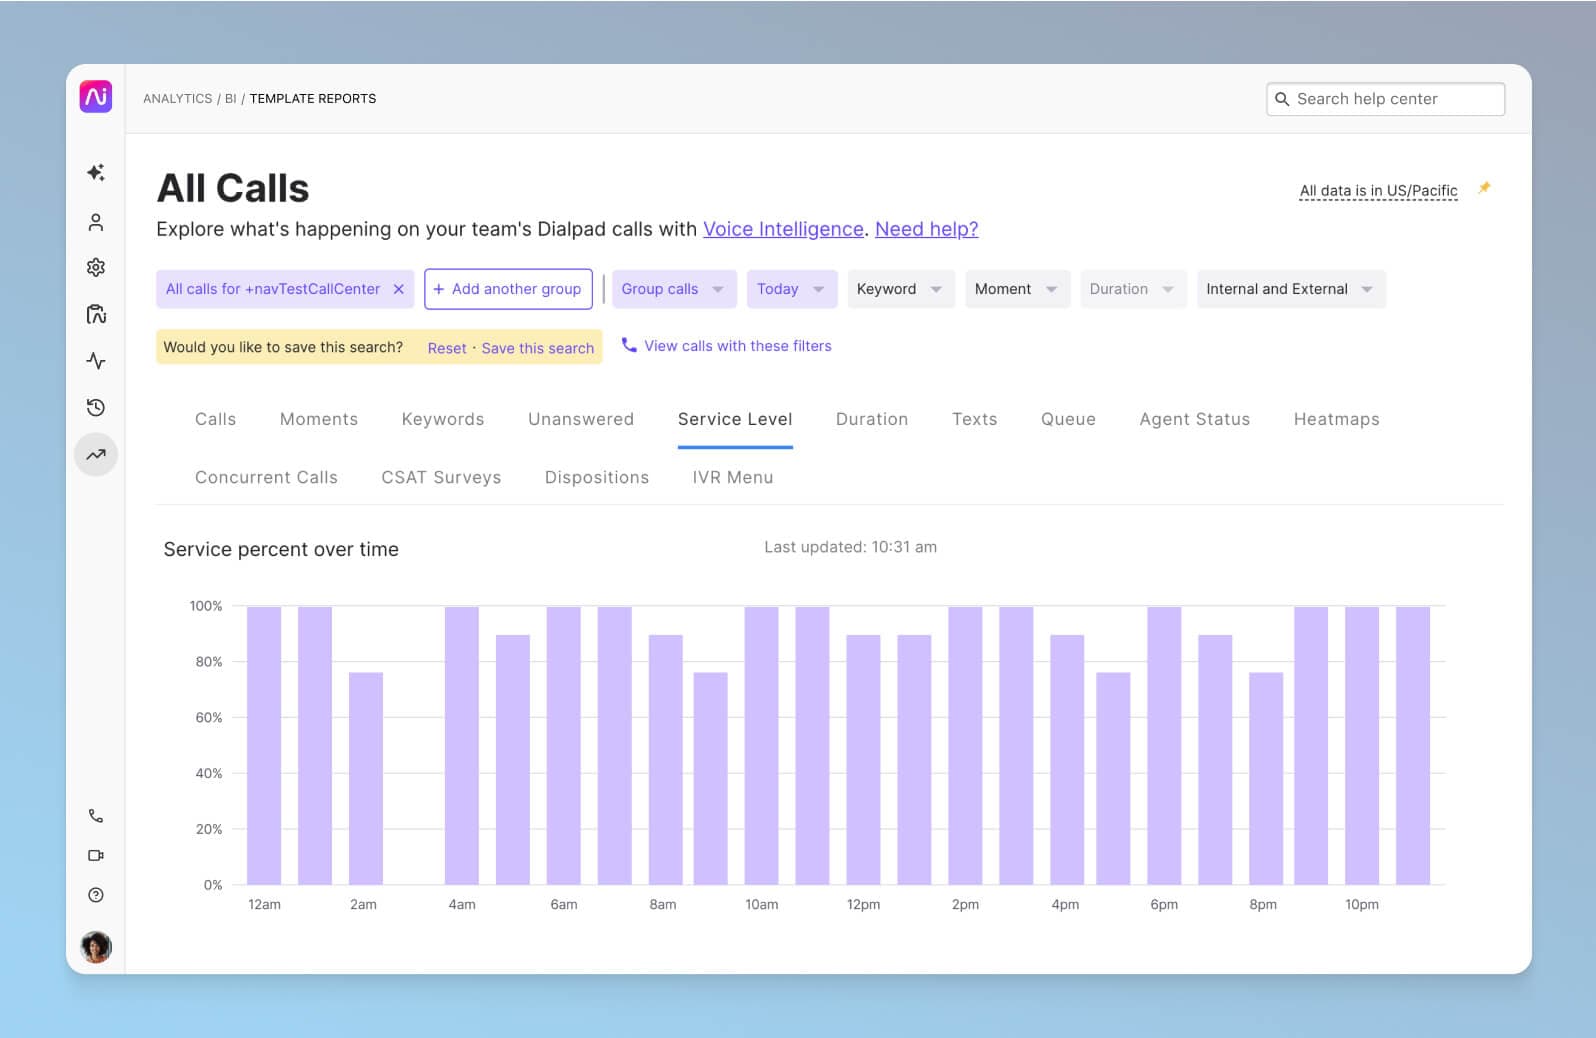
The service level call center metric tells you the percentage of customers who are provided support within a set amount of time. Generally, the industry standard is to serve 80% of calls within 20 seconds, but depending on your industry or channels you’re serving (e.g. social media has different service levels than phone calls), you may have different service level targets such as 70/20, 80/60, or other models.
Dialpad has a service level notifications feature that automatically pings us if our service levels drop below a certain threshold:
8. CSAT score
Almost all customer support teams measure CSAT (customer satisfaction) scores. To track CSAT, you first need to gather feedback from your customers. This is typically done through surveys conducted after calls and live chats, or sent via digital channels such as email.
Other than being a general team performance metric, your CSAT scores are also a good leading indicator for when you might need to beef up your retention strategies or tackle customer churn—before you actually lose customers for good.
Some contact center software have built-in CSAT surveys while others require you to do calculations to figure out customer satisfaction. With Dialpad, you can create a CSAT survey with just a few clicks.
One thing to keep in mind is that the challenge with CSAT surveys is that not a lot of people actually fill these out. In fact (depending on the industry and specific business, of course), we've found that on average only about 5% of customers actually fill out CSAT surveys. On a related note, usually only the angriest—and happiest—customers actually bother to do this, which means your CSAT answers are likely to be very skewed by outliers. They’re not necessarily representative of your actual audience on a holistic level.
That‘s what Dialpad's industry-first Ai CSAT feature is designed to solve.
Not only can our Ai transcribe calls and analyze sentiment in real-time, but it can also predict CSAT scores for 100% of your calls. The result? A much more representative sample size, and a more accurate understanding of how satisfied your customers really are.

Ai CSAT can help you open a new world of possibilities for gathering customer intelligence, giving you more insights from a source of data you already have: your everyday customer conversations.
Using call center dashboards: Examples of how your call center can make the most of them
Example 1: An overwhelmed call center
Let's say your call center is overwhelmed by calls, and you're at a loss in terms of how to staff agents more effectively. You could look at your dashboard to see what times during the day (and which days in the week) the most calls are coming in, then staff your team with those high-volume time periods in mind.
Example 2: Want to improve coaching
What if you want to see which agents are doing well, and which ones need a little extra coaching? From your call center dashboard, you should be able to see leaderboards and agent-by-agent metrics like CSAT score and average call handle time, which can give you a good idea of which agents are struggling and need a bit of extra help.
Example 3: Slow QA
Quality assurance can take time, especially if you're one manager overseeing a team of 10 or 20 agents. Your dashboard (and some call center AI tools) can help by analyzing agent calls for you and suggesting if the agent has fulfilled the tasks listed in the QA scorecard, which can save hours for busy supervisors.
Other important features in call center dashboard software
To reiterate: You shouldn’t need a separate contact center performance dashboard tool or software. A good contact center platform, like Dialpad, should include built-in analytics and contact center reporting.
Beyond that, here are a few other boxes to check off.
Omnichannel communications
Can your agents have phone calls, video calls, and SMS messaging with their teammates—and handle external communications with customers via live chat, social media messages, and voice calls?
Many cloud contact center platforms have to tack on third-party providers and add-on fees in order to give you this type of omnichannel experience. Ideally, you’ll want a contact center platform that has all of this already fully integrated, which is more cost-effective and less of a hassle to admin in the backend for IT:

Real-time transcriptions
Dialpad Ai can transcribe our customer calls and video meetings—in real time:
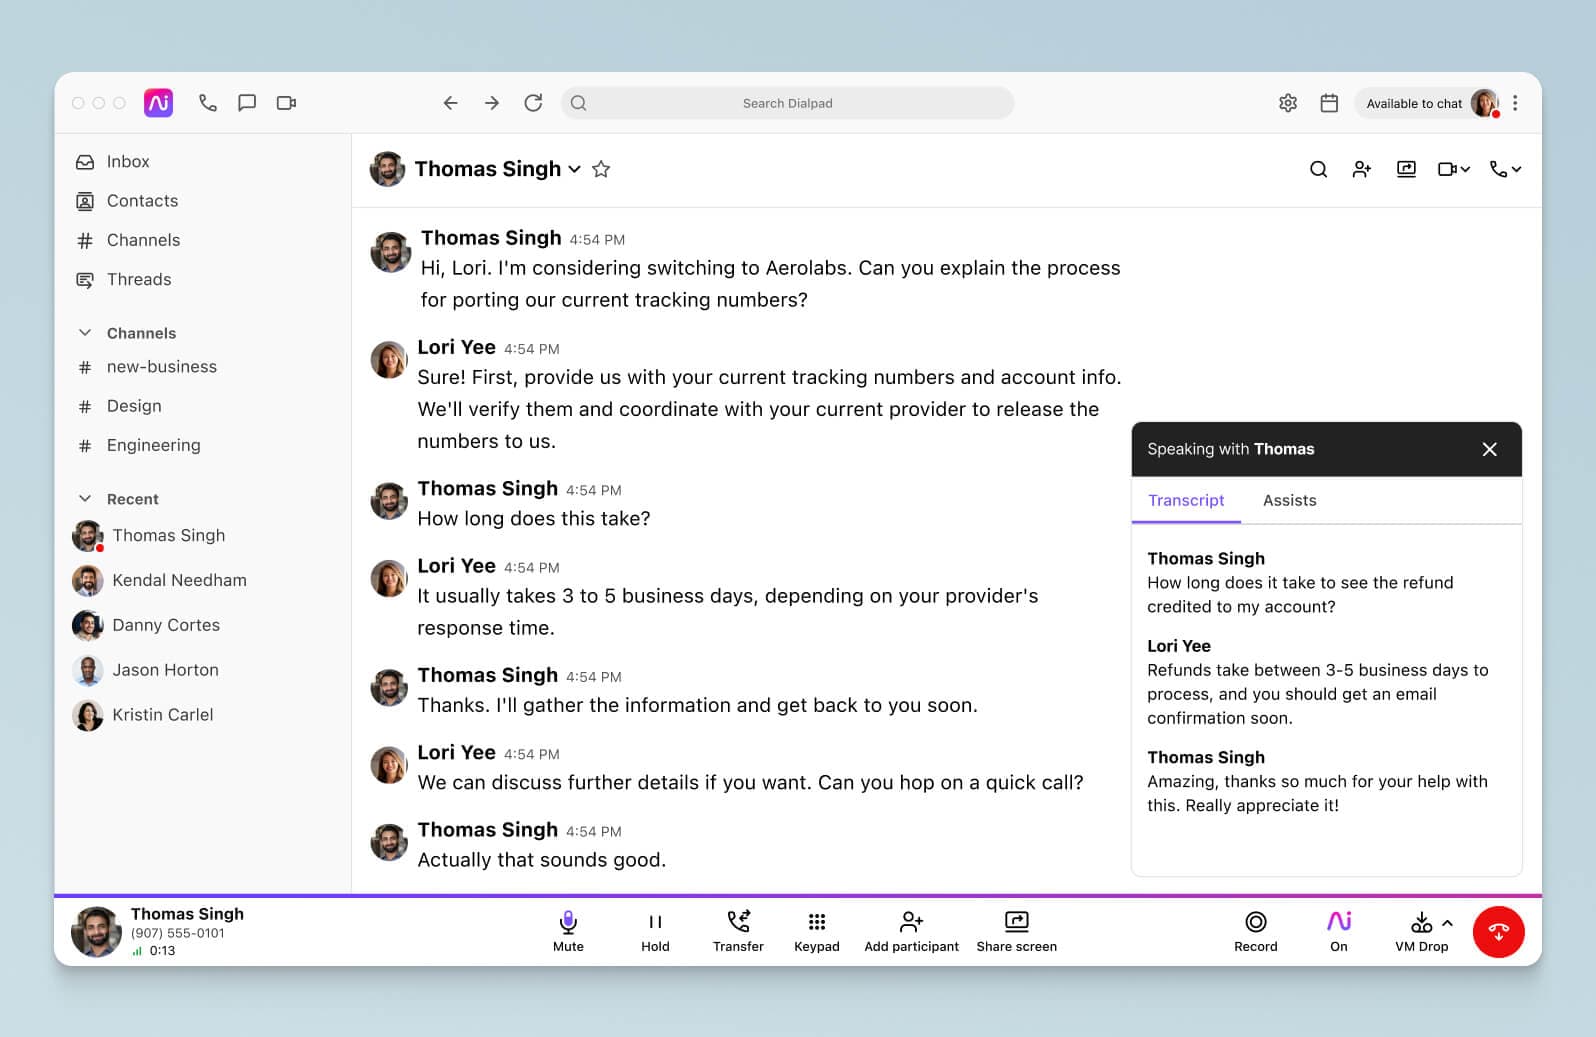
This is crucial for us when we do quality assurance and training, since we can search these transcripts and skip to specific sections (instead of having to listen to a full call recording).
And this leads into another important feature we use...
Real-time sentiment analysis
Not only can Dialpad Ai Contact Center transcribe calls in real time, it can also analyze the sentiment of our customer calls in real time. For managers like myself, who need to monitor multiple simultaneous active calls, it’s important to be able to quickly see if a conversation is going south:
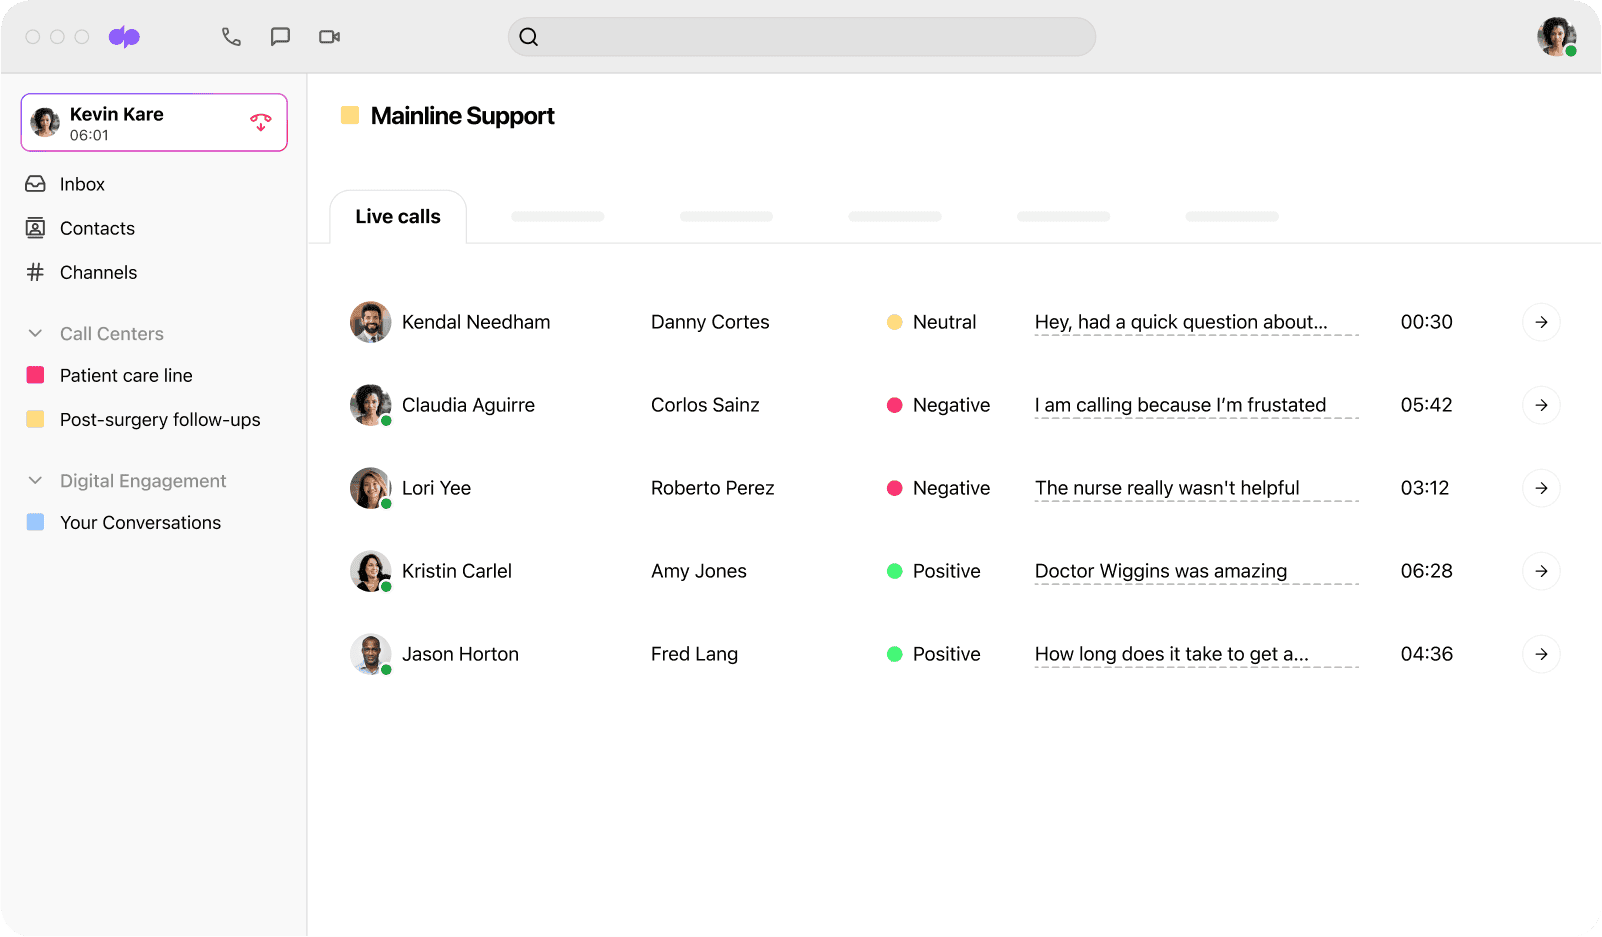
Dialpad lets us do this. And if I do see a call drifting into negative sentiment territory, I can just open up the real-time transcript to get more context, before deciding whether I need to jump into the call to help the agent.
Integrations with other software you’re using
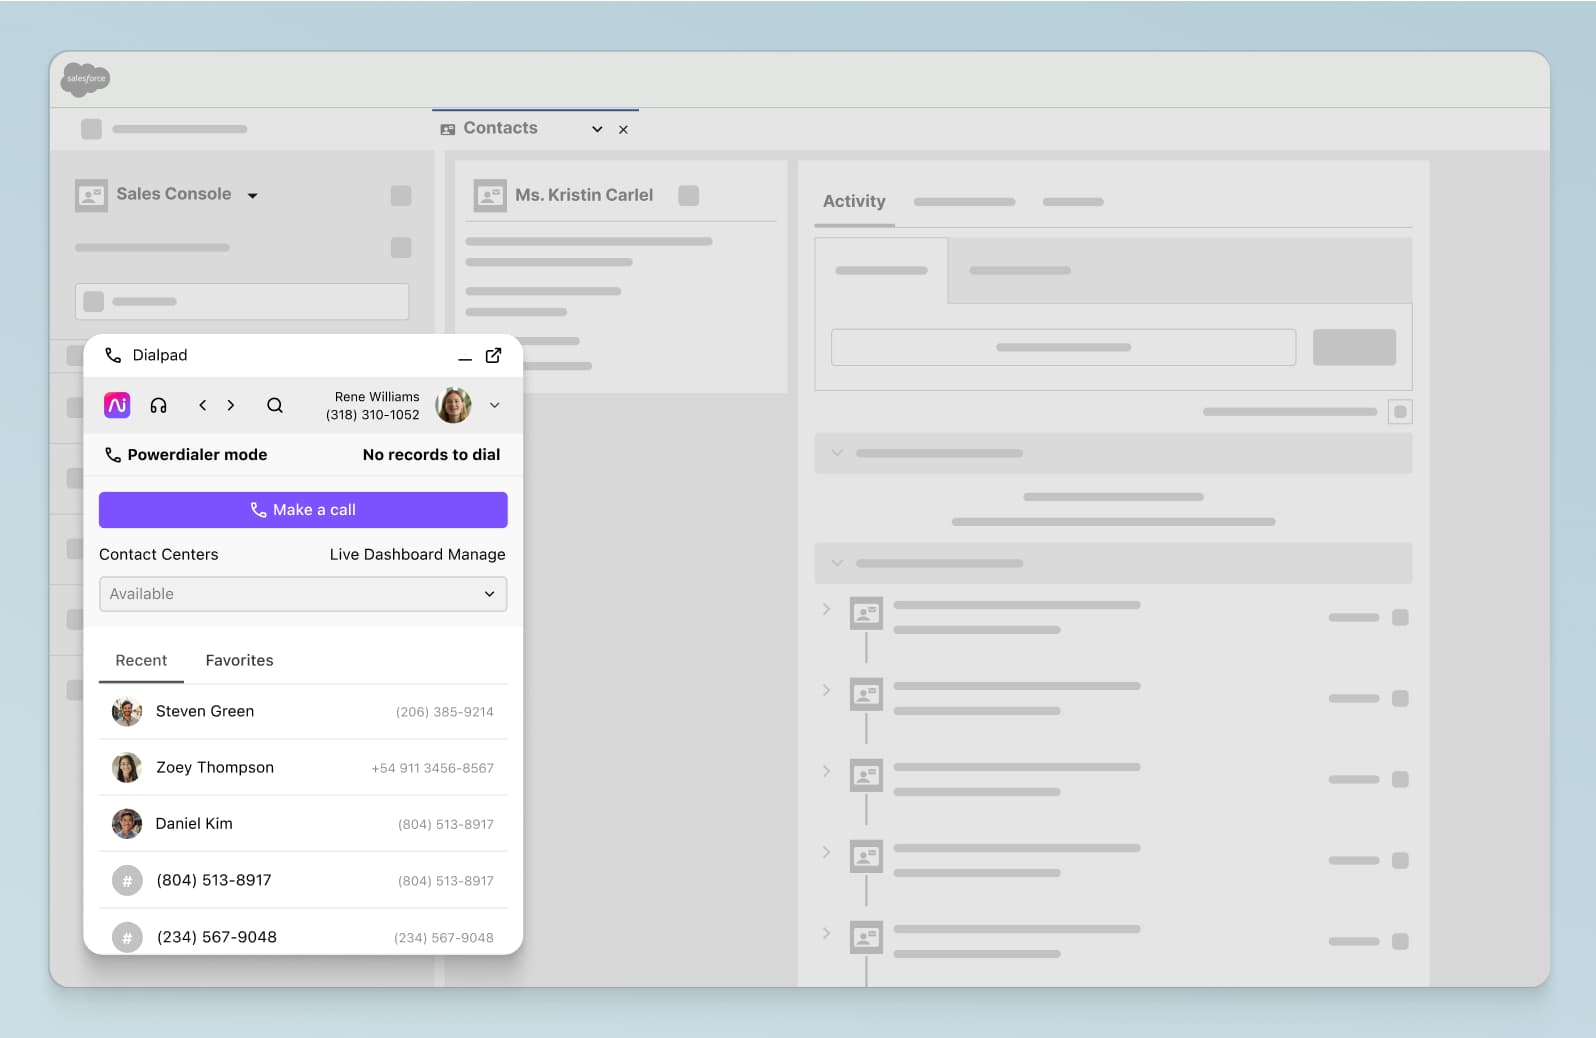
If you’re using a CRM, a ticketing system, help desk software, or even just an everyday productivity tool like Google Workspace, your contact center platform should integrate with them! This can take a lot of repetitive, manual data entry tasks off your agents’ plates and improve team performance overall.
For example, Dialpad integrates with CRMs like Salesforce to not only embed a phone dialer directly inside those tools, but also automatically log calls and other activities in the CRM:
Strong compliance standards
We have many customers in regulated industries like healthcare, law, finance, insurance, and more. This means that Dialpad has to adhere to strict compliance and security requirements.
That’s why it has enterprise-level encryption, role-based access, and custom data retention policies, in addition to SOC2® Type II compliance. And yes, we can help businesses and organizations stay GDPR- and HIPAA-compliant.
4 things to keep in mind when shopping for new tools
1. A good contact center platform should come with analytics built-in
You don‘t have to—and honestly you shouldn‘t—pay for a separate reporting tool. Good contact center platforms have built-in call analytics that give you reporting and visualizations in real time from the platform dashboard.
2. Ideally, you need real-time and post-call analytics
When it comes to analytics, some solutions will focus on post-call metrics while others will track certain KPIs via real-time dashboards. Know which metrics you‘ll need to monitor in real time.
3. It should be easy for your agents and supervisors to access data
Don’t settle for a solution that makes you contact a support team—or hire your own IT consultants—every time you need to pull data.
For example, you may want agents to be able to see leaderboards to have some friendly competition. Sure, different roles might look at different metrics, but the point is, data shouldn’t be a black box. It should be accessible.
4. Customer support should be top-notch and available when you need it
This is an important one that tends to get overlooked. Your contact center platform should have good customer support behind it! Honestly, this goes for any type of software you use, not just a dashboard or reporting tool.
Even with the best and most reliable software out there, things go wrong and software can crash from time to time. Look for 24/7 customer support from your provider, ideally through not just emails and live chat, but also the phone. That’ll keep you covered—and an online Help Center won’t hurt either.
Don’t just get a call center analytics tool
Having contact center analytics that are built into platforms like Dialpad Ai Contact Center can help you improve the way your team operates and handles calls. Not only will you get analytics in real time, you'll also be able to pivot quickly and anticipate problems before they come up.
Make sure your contact center dashboard has an intuitive user interface so that even team members who aren't tech-savvy can find the data and KPIs they need. And if you're looking for a call center or contact center platform, why not check out Dialpad?
See how our own support team uses Dialpad's contact center dashboard!
Book a product demo to get a personal walkthrough of Dialpad Ai Contact Center. Or, take a self-guided interactive tour of the app first!


