

If there’s one universal truth when it comes to running a call center, it’s this: the list of KPIs (key performance indicators) you could measure is almost endless. Handle times, CSAT, churn… How and where do you draw the line?
How do you identify the metrics that really matter, that will help you to deliver on experience, efficiency, and satisfaction?
To find the answers to these questions, I think the most important thing to do is consider your goals. Call centers all have different goals. Our goal at Dialpad for example, is to provide world class support at all times.
From there, everything falls into place. Once you know what you’re trying to achieve, certain metrics start to make more sense than others, because any metric that doesn’t directly lead to improvement in the support we provide is immediately less useful than those that do.
In this blog post, I’ll go through 15 essential call center KPIs. Not all of these will be useful to you! (Every contact center is different, right?) This is just a good initial list for you to think through as you’re considering which KPIs are best for your contact center:
First response time
Average abandonment rate
Percentage of calls blocked
Average time in queue
Average after-call work time
Cost per call
Revenue per successful call
Occupancy rate
Agent turnover rate
Net promoter score
Customer effort score
Customer satisfaction
But first, before we look at all the metrics, one important thing to keep in mind...
Not all metrics will capture your customer experience goals
If you want to get straight to the KPIs, feel free to skip ahead.
The best way to figure out which metrics are helping you capture your goals is to consider the outcomes that each one is measuring—and then work backwards to check the relevance of each of these outcomes to those goals.
Otherwise, you might just be left with a dashboard full of charts and numbers, but no useful way to gain insights or actionable next steps from that data.
Even if it is a well designed and cleanly laid out dashboard, like in Dialpad Ai Contact Center:

To really illustrate the importance of this, here's an example.
Say you’re running your own Avengers team. You want to make sure that your team is protecting the Earth from villains and other attacks, so in order to measure the effectiveness of your heroes, you come up with some metrics.
A helpful one might be “reduced injuries among civilians,” because that would show you that your Avengers are keeping the population safe.
On the other hand, an unhelpful metric could be the number of people tweeting with the hashtag #Avengers, since this only tells you that your team is being talked about, and not whether people are praising or criticizing them.
The same general idea applies when you’re searching for metrics to help you achieve your customer experience goals.
At Dialpad, our goal is for every call center agent to be able to help customers as efficiently and effectively as possible. That’s why we need to use call center KPIs and metrics that will ultimately help us increase customer satisfaction and/or call center agent productivity.
In other words, every metric has to measure whether we’re enhancing the customer experience, or whether our overall agent performance is improving.
Before we get into the details of which KPIs help us achieve this goal, we’re going to take a look at how to make sure that your agents are working towards improving their performance under those metrics.
Aligning your agents with your call center KPIs and metrics
A crucial part of working as a call center agent is knowing and understanding your call center’s KPIs and metrics. That way, it’s easier to align yourself with both those metrics—and the goals of the company you’re taking calls for.
But how exactly does that look, up close?
The first thing to know is that aligning team members with goals and KPIs is a key responsibility for all call center managers. They should understand their call center metrics well first. This way, it's easier to train your agents to work in harmony with those metrics, and it also reduces behaviors like call avoidance.
This includes knowing exactly which aspects of your call center need improvement, and how to help your team members work towards making sure that the next month’s metrics will show better and better results.
All of that can be difficult to do as just one manager looking after many team members with different levels of skill and experience. I should know—I run five contact center teams.
(And I can’t imagine doing it without good software that genuinely makes call center management easier.)
Okay. Let’s get into the metrics.
15 essential call center KPIs and metrics
Now that we’ve covered the importance of aligning your agents with your KPIs, it’s time to look at what exactly those KPIs should be.
Like I mentioned above, there are plenty of different metrics that can be useful to a call center. These are just 15 commonly important ones that make up the difference between a good call center and an excellent one.
👉 Dialpad tip:
Bear in mind, I’m coming at this from a customer support angle! Contact centers can be used for many other functions as well (like sales, and even HR), so those KPIs will look different from the ones I’ve listed here. Certain KPIs might be universally applicable, but that’s why it’s so important to figure out your specific goals first—otherwise you’ll just be tracking the wrong KPIs for your business.
1. Average handle time (AHT)
This KPI exists to tell you how much time your agents are spending on each call, on average. The shorter your call center’s AHT is, the more quickly your customers’ queries are resolved.
The goal isn’t necessarily to make sure that your call center’s average speed of answer is under a minute, or anything as drastic as that.
You’re not trying to turn every agent into some kind of Superman type whose average call only lasts 30 seconds and yet manages to solve every problem and direct each customer to the perfect product for them. Trust me, I’ve tried. (Kidding.)
Instead, what you’re looking to do is figure out what the minimum and maximum amount of time is in order to pin down, address, and resolve the average problem. You then want to encourage employees to aim to keep customer call lengths between these two extremes.
If your AHT is suddenly surging, that can be a telltale sign that your agents aren’t sure how to resolve queries or help customers. This means that your agents need more training, support, and guidance.
When it comes to AHT, it’s also important to keep in mind that some situations call for longer handling times—to increase the quality of the service that your clients receive. (In Dialpad, what I love is that I can just go into the app—or even use my web browser!—and look under the contact center analytics tab to see AHT trends.)
👉 Dialpad tip:
A customer with a more complex problem needs more time to receive proper care, after all, and is just as important as one with a simple problem. Don’t encourage agents to cut calls short just to keep AHT low, since this can easily lead to a drop in quality of care.
In other words, what you’re looking to do is prioritize the quality of service over the quantity of calls taken.
Read on to learn more about measuring the quality of the care your call center provides!
2. First response time (FRT)
First response time (FRT)—not to be confused with first call resolution, which I’ll talk about later—refers to the amount of time between a customer calling to flag up an issue and an employee addressing that issue.
Unlike AHT, you do want to shorten your FRT as much as possible. That way, you’ll have a metric to prove that your customers barely need to wait for their issue to be resolved.
Think about it. If you were reaching out to your bank or insurance company with a question, would you try to go with “your favorite” channel (like social media), or would you choose the channel that gets you an answer most quickly?
If I had to guess, I’d choose the latter.
That’s why addressing a customer’s issue as quickly as possible is crucial for my teams. The shorter our FRT, generally the more satisfied our customers will be.
Again, I can see this really easily in Dialpad—there’s a heatmap that shows our average speed to answer, which is basically the same as FRT:
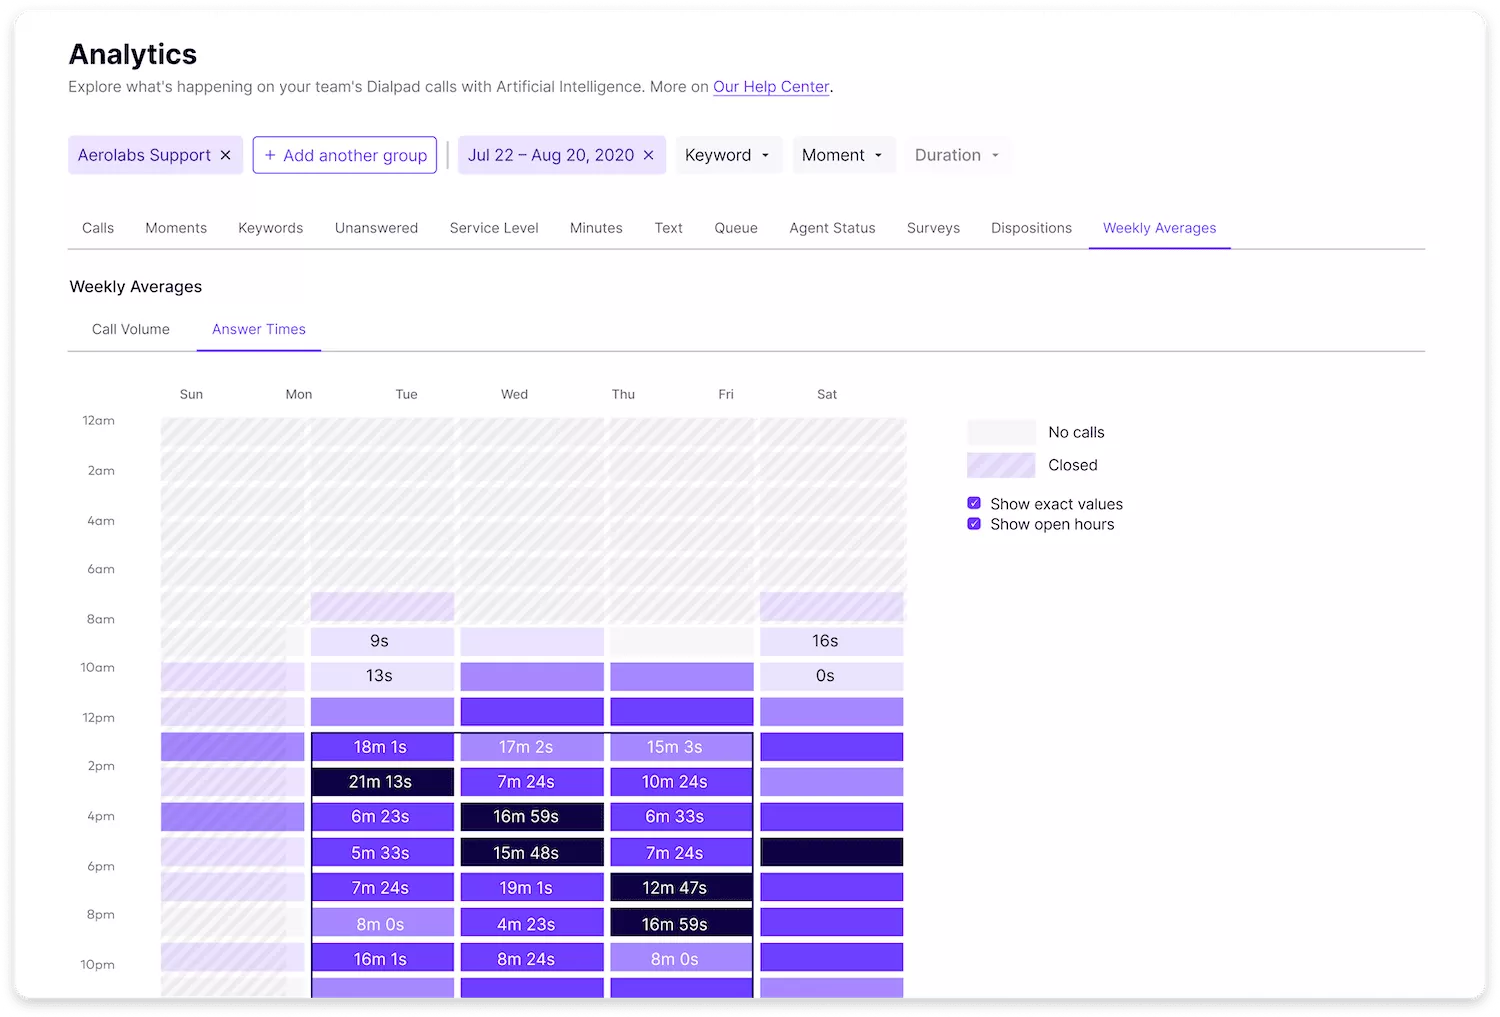
On the business end of things, recording and evaluating FRT helps with contact center workforce management. FRT values can help show a business when they need to hire more agents so that their customers consistently get that quick response time they’re looking for.
This keeps customers happier before they even reach an agent, which improves their overall experience significantly—and makes sure your agents don’t start off on a bad note. If there’s any way that you can improve your customers’ feelings about your call center performance before they even start talking to someone, do it!
3. Average abandonment rate
This KPI refers to the number of abandoned calls a call center records in a given amount of time, such as a month.
Abandoned calls are the ones that end before they ever reach an agent. This includes times when customers hang up while they’re in the queue, or while they’re listening to the menu options. (Call abandonment can also happen when a caller gets sent straight through to voicemail instead of being directed to an agent.)
Generally, the lower your abandonment rate, the better.
One thing I try to do as I’m coaching my team is keep an eye on if certain agents have many more abandoned calls than others. In Dialpad, there’s a leaderboard that shows this cleanly:

No matter the reason, it’s important to log abandoned calls. For example, you need to know if your customers are abandoning calls on purpose (by choosing to hang up), or whether they’re being sent to voicemail or having their call ended automatically.
If callers can’t get their inbound calls through to your call center, you’ve got to figure out why, so you can change this.
Sometimes, abandoned calls aren’t “your fault”—what if someone called and hung up in the first second? There’s not much you can glean from that, and we call them short abandoned calls, in which the caller hangs up within a specific time frame that we define. In Dialpad, you can exclude these from your service level calculations by setting the threshold at anywhere between 0 and 60 seconds:

4. Average speed of answer (ASA)
This is a measure of how quickly your agents are able to provide solutions to customer issues. (Unlike “average speed to answer,” which I touched on above and refers to first response time, essentially.)
While it’s connected to AHT, this KPI refers to the total time taken by the agent to find the specific answer a customer needs, rather than the duration between the moment the agent answers incoming calls and its end.
ASA should be kept as short as possible. The more experienced and, more importantly, knowledgeable an agent is, the easier it’ll be for them to cut down their ASA. That’s because agents who are familiar with a broad range of solutions will be able to answer a customer’s question more quickly, without having to second-guess their answer.
Dialpad has a feature that I absolutely love that helps with ASA. They’re called Real-Time Assist (RTA) cards, and especially for newer agents, they’re super helpful.
If I notice that certain tricky calls about pricing, for example, are coming in, I can create an RTA card with notes on our pricing, and have these automatically pop up whenever a customer says “price” or “pricing” on a call:

You can set whatever trigger words you want for RTAs, and customize the card content however you like. It’s been a big help for our contact center and allowed me to continuously train and teach agents while cutting down on their ASA.
5. Customer satisfaction (CSAT)
Here’s one you’ve probably heard of. This KPI is all about measuring how happy your customers are with the service they’ve been given.
CSAT is usually measured by asking customers directly what they thought of your call center’s service. They’ll be asked to rate their experience, and then given the option to leave feedback.
Since the CSAT feedback forms are sent out immediately after a call ends, you can see how your agents are performing in real-time based on their CSAT scores.
In Dialpad, it’s easy to create a CSAT survey right from your Settings page:

You can then add any scripts and questions. This is a versatile metric for setting benchmarks for your agents by having CSAT scores as a goal everyone works towards.
That way, you can give your agents clear guidance on what their targets are, and you can provide your customers with service quality assurance.
Of course, though, there's one big issue with CSAT surveys: Most customers don't fill them out.
In fact (depending on the industry and specific business of course), we've found that on average only about 5% of customers actually fill out CSAT surveys. On a related note, usually only the angriest—and happiest—customers actually bother to respond to these surveys, which means your CSAT answers are likely to be very skewed and not representative of how your customers feel overall.
Dialpad's industry-first Ai CSAT feature is designed to solve exactly that. Not only can our Ai transcribe calls and analyze sentiment in real time, it can also infer CSAT scores for 100% of your customer calls thanks to its hyper-accurate transcription feature. The result? A much more representative sample size for CSAT scores, and a more accurate understanding of how satisfied your customers really are:

6. Average time in queue
This can be a difficult KPI to assess, since queue times depend very much on the call volume per hour.
During peak hours, your agents will likely experience a massive increase in their total number of calls, meaning that more agents and quicker turnaround times are required to keep customers’ average time in queue as short as possible.
As a general rule of thumb, if your customers’ average time in queue is consistently high, that means you’ve got a staffing issue. This can be fixed by hiring more agents (or improving your current agents’ performance or productivity, which is harder to do).
Customers’ average time in queue is usually an easy metric to analyze. Shorter is always better, no exceptions; nobody likes longer wait times.
I can easily keep on this in Dialpad, including who / which numbers are in the queue and how long they’ve been in the queue for:

If your callers don’t have to wait long for you to pick up—on a consistent basis—it’s a huge sign that you’re doing something right in your contact center. (And in my opinion, when it comes to customer service, this plays a role in improving customer loyalty.)
7. Average after-call work time (AWT)
After call work time (AWT) is the term for how long it takes agents to process tickets between calls.
Often, customers call to flag issues that they don’t necessarily need to stick around for or need a resolution right away for. Your agents still need to make sure these issues are addressed, but they also don’t necessarily need to make their callers wait around.
In some cases, agents can make a note of issues to resolve, hang up, then actually resolve the issue.
This way, agents avoid having to put their customers on hold, only to take them back off and say, “Yep, this is working now.” Callers’ total average hold time drops, and agents can offer a more streamlined customer experience—it’s a win-win all around.
👉 Dialpad tip:
Use this judiciously! The downside of handling the bulk of your issues this way is that the average AWT goes up.
In Dialpad, you can set a “post-call wrap-up time” that functions in a similar way—even though not every call requires AWT, it’s also nice to give your agents a bit of a break between calls:

Depending on your contact center and the KPIs that are important to you, this one may not always be relevant. It does bring us back to the earlier point on quality of service being more important than the quantity of calls taken.
Having longer AWT ensures two things: Firstly, customers aren’t being asked to hang tight while agents work away silently at a computer screen that the customers can’t see. Secondly, without the pressure of having to finish what they’re doing as quickly as possible, agents might be less likely to fumble or make mistakes.
Essentially, the idea of “the shorter, the better” doesn’t always apply when it comes to AWT.
It’s an easily measurable metric that’s surprisingly complex. Longer AWT means that any one agent might be able to take slightly fewer calls—but that those callers’ issues are resolved the first time they get in touch with your team.
8. First call resolution (FCR)
FCR is all about giving the right care and support from the get-go.
This KPI measures how often a customer’s query is resolved the first time they reach out to your call center team, which is why it’s also referred to as ‘first contact resolution’.
Studies have confirmed that higher FCR rates lead to higher customer satisfaction levels—customers reported a greater degree of satisfaction as the company’s FCR rate went up.
To put it another way, the fewer times your agents need to give clients a call back, the better they’ll perform in terms of FCR. It’s not always in your control though—sometimes, a customer just doesn’t have the information ready at hand the first time around, or they might need to confirm something. That’s not great for your FCR rate, but it’s also not a reflection of the quality of your customer support.
9. Cost per call
Companies have to pay a specific price per call. This price is determined by the call center software they’re using, as well as the length of each call.
In most cases, longer calls will cost more. At the same time, a longer call has the potential to save companies money on the whole, since the customer placing the call will be less likely to need to contact them twice. It’s a balancing act!
Of course, if your call center’s using the right software, this might be a moot point because you’re charged a fixed price for unlimited calls. Another factor to take into account is messaging and its associated costs, which are not the same as phone calls. After all, not every modern call center exists purely to take calls.
👉 Dialpad tip:
Some business phone providers or contact center platforms may set you up with an SMS and MMS plan to open your contact center up to these messaging channels with customers.
10. Revenue per successful call
Keeping track of the average amount of revenue that a successful call is likely to generate is a helpful way of measuring the monetary value of each call.
This isn’t quite in my team’s purview, but would apply more to sales and Customer Success teams. This metric covers two key aspects of a call center rep’s efforts:
First, it shows how many products, on average, your agents are successfully directing their callers to.
Next, it shows whether agents are hitting their sales targets (or, hopefully, even exceeding them).
When you also consider which products are generating that revenue and helping agents meet their targets, you’ll also get some helpful insight into which products are the most popular.
Something to keep in mind with this KPI is that according to the American Customer Satisfaction Index, customers that reported a higher degree of satisfaction were also more likely to bring more revenue to a business:
That means that if your agents have a high average value for revenue per successful call, they’re also providing excellent customer service. Great customer service boosts customer retention, which then helps to increase sales in the future.
11. Occupancy rate
A call center’s occupancy rate is the percentage of time its agents spend on call-related activities, including taking calls and AWT.
You can calculate a call center’s average occupancy rate by putting your agents’ data into this occupancy formula:

Source: callcentrehelper.com/agent-occupancy-89603.htm
If your maximum occupancy sits comfortably in the 75 to 85% range, then your agents are working optimally.
But wait, shouldn’t occupancy be at 100%?
Our instinct might suggest this, but it’s not actually the case. At 100% occupancy, agents are taking absolutely no time between calls, meaning they’re working literally like machines.
In a practical sense, this doesn’t work for a few reasons, not least of which being the fact that your call center probably isn’t staffed by Replicants from Blade Runner.
Agents who aren’t taking any time to discuss their cases with their coworkers are missing the chance to learn and pass on new, useful ways to help customers. They’ve also got no time to attend training sessions, take notes after a call, or otherwise work on raising the service level they provide.
That’s why it’s important to aim for a maximum occupancy rate of no higher than 90%.
12. Agent turnover rate
The lower your agent turnover rate within a set time frame, the better your call center is doing.
How can one KPI be so indicative of the overall state of a call center?
The answer is deceptively simple: Happy agents don’t want to leave. And a call center full of agents who are motivated to work hard and stay with your company is one that’s going to bring the best results.
Okay, granted, it can be very difficult to reduce your agent turnover rate to zero. That doesn’t mean you shouldn’t try, though. In fact, some of the most effective ways to reduce your agent turnover rate boil down to making sure agents are properly motivated.
Another simple, but overlooked, way to reduce agent turnover is to use software that helps them do their work more easily.
(And not to toot our own horn, but Dialpad’s cloud contact center platform provides all the features an agent could need, wrapped up in a neat package with a user-friendly layout. When your agents’ software supports them like this, they’ll be less likely to face burnout—and ultimately, less likely to leave your company.)
13. Net promoter score (NPS)
NPS is a popular one. It’s particularly useful when it comes to putting a number to customer satisfaction.
NPS is measured on a scale of -100 to 100. Customers fill out an NPS survey asking them how likely they are to recommend a company to a friend or family member. The higher the score is, the more likely the customer is to recommend the company.
The better your NPS, the more word-of-mouth promotion you’re getting. If you think your call center’s average NPS could use some work, one major area to look into is the quality of your voice connection.

👉 Dialpad tip:
If you’re not using a high-quality VoIP provider but take a lot of calls on a daily basis, a low NPS score might be an indicator that it’s time to make the switch.
14. Customer effort score (CES)
CES is a metric that’s designed to measure how much effort a customer has to put in to get their query resolved. The goal here is to make it as easy as possible for customers to get what they want.
Many other factors impact a call center’s CES. For example, long queue times increase the effort customers need to exert—if you know an agent could pick up anytime, you can hardly have a shower or bust out the karaoke machine, after all.
Having a high transfer rate does the same thing, since that’s just an indirect way of saying that customers will be put on hold more.
Thankfully, there’s also a lot of things you can do to lower customers’ effort input. Ensuring that your agents are well trained is a major one, since that improves both the overall issue resolution rate and the quality of care offered to customers.
In short, a call center’s CES can be a great indicator of whether you need to make the calling process easier for your customers.
15. Percentage of calls blocked
It might seem counterintuitive at first to want to block calls at a call center. The whole point is to accept incoming calls, right?
Well, not quite.
Call centers aren’t immune to spam calls, unfortunately. As the arrival rate for these types of phone calls continues to rise, call centers have had to adapt by using call blocking software.
When we’re using Dialpad, for example, we’re relatively confident that the software’s in-built spam blocking feature is keeping unwanted calls away. You can even customize which types of spam calls get blocked, if specific ones seem to be slipping through the cracks.
Wasting any period of time on the phone with scammers and spammers—even just a few moments—means taking away from what could otherwise be talk time spent with a customer. I don’t like it, and I find it useful sometimes to keep track of the number (and percentage) of calls your software is blocking for you.
(After all, you want to be able to say confidently that your agents waste no time with detractors, and instead give all their attention to callers who actually need their help.)
Maximize your operational efficiency with call center KPIs and metrics
The KPIs I listed above are a great start in making sure your call center is running as smoothly as possible. If you’re looking for a way to measure things like how effective your agent utilization is, or whether your IVR system is serving customers the way it should, this is a good place to begin.
Always remember: The key to using KPIs to your advantage is to make sure your metrics are focused on specific, measurable factors. Instead of just broadly stating you want to know whether your customers are happy with your service, for example, you might say instead that you’re going to start sending out CSAT surveys.
Choose the KPIs that work best for you, and happy measuring!
Set your contact center up for success and hit your KPIs!
See how Dialpad Ai Contact Center can help make your agents' and supervisors' lives easier—while empowering them to hit their targets. Book a demo or take a self-guided interactive tour of the app on your own first!